Data

Minor Software

Minor Software

Project details

Project type:
ECTS:
Time:
Client:
Nature:
Keywords:


Minor
30
2016/2017
TU Delft
Individual & Group
AI, Bayesian network, C#, Evolutionary algorithms, Genetic algorithm, Java, Neural network, Object-oriented programming, Scrum & Unity

Project type:
ECTS:
Time:
Client:
Nature:
Keywords:

Minor
30
2016/2017
TU Delft
Individual & Group Project
AI, Bayesian network, C#, Evolutionary algorithms, Genetic algorithm, Java, Neural network, Object-oriented programming, Scrum & Unity

Summary

During my bachelors, I did my minor in software at the TU Delft. During this, I followed several courses in computer science and did a project within the minor where we had to apply our knowledge and create a game in Unity. During this time I learned how to program in Java and C# using the Object-Oriented programming paradigm. I also took a course on computational intelligence where I learned the basic of artificial intelligence, Bayesian networks, evolutionary algorithms and neural network. During the game project, I led our multidisciplinary team and learned how to work using Scrum.

Courses

During my minor, I took several computer science courses. During my course in object-oriented programming (OOP), I learned how to program in Java and how to program in an object-oriented way. During my course on computational intelligence, I learned the foundation of AI in general and we learned how to apply three types of AI, Bayesian networks, evolutionary algorithms and neural networks. The neural networks were created inside of MATLAB and compared to the build-in tool in MATLAB. The evolutionary algorithms were programmed using Java.

Game Project

During the second half of the minor, we had a project where we had to apply our knowledge by creating a video game in Unity. This was a group project consisting of 6 members from the minor, each from a different study of the TU delft. During this project, my main responsibility was to lead the group in successfully creating a game. To do so we utilised Scrum and I learned how to be the scrum master. Next to being the scrum master, I helped out with the game design, game UI and game Graphics. I also programmed an evolutionary algorithm into our game which made created a dynamic difficulty with the enemies adapting to the playstyle of the player.

IoT Basketball Wheelchair

IoT Basketball Wheelchair

Designing Data-Driven products and Services for the Internet of Things

Project details

Project type:
ECTS:
Time:
Client:
Nature:
Keywords:

Elective
3
2018
TU Delft
Group Project
AI, Data, IoT

Project type:
ECTS:
Time:
Client:
Nature:
Keywords:

Elective
3
2018
TU Delft
Group Project
AI, Data, IoT

Summary

The goal of this elective was to design an IoT product and/or service system out of a wheelchair. To ensure we could design impactful features we decided to specify our target group from wheelchair users to basketball wheelchair users. From there we set out to design an IoT product that would provide both the users and the manufacturers of these wheelchairs with additional value. The final design embeds the wheelchair with 4 types of sensors, an optical encoder, a gyroscope, an RF receiver and a seat pressure matrix. These four sensors allowed us to add 3 additonal smart features to the wheelchair, iTactiX, Exhaustion Detection & Tired.
iTactiX is an feature to improves players tactical play by showing them wether they should take a shot at the basket from there current possition or pass to a specific team mate.
Exhaustion Detection aims to prevent injuried by measuring their exertion through a training and looking for abnomolies.
Tired is a system to detect the wear and tear of the tires. It allows the manufactur to give the players buy advice when their tires are in need of replacemant and is able to offer specifc tires based on their play style.

iTactiX

iTactix is a training feauture to help teams improve their tactical play in matches. It gives players suggestions on to who they should pass or if they should shoot on the basket. It bases these suggestion on location, orientation and acceleration data gathered throughout training and matches. This data allows the wheelchair to calculate in real time what the best option is given the players current location, orientation and velocity.

Succes formula
Technical diagram

Exhaustion

Exhaustion is a feature to help prevent players injuries. It should the players how much energy they have exerted compared to how much energy they normally have. It does this by creating a profile for each player conisting of data about each training they have and the forces they exerted throughout each training.

Succes formula
Technical diagram

Tired

Tired is a service what offers personalized tire advice to the basketball players. It does this by gathering data on the usage of the tires and makes a profile on how a player plays. It uses this information to offer tires with different friction or profiles that would fit their playstyle better. It also is able to predict tire ware and can use this to give the players a prompt when they should buy a new set of tires.

Succes formula
Technical diagram

Final Video

Improving the Intelligence of a Roomba

Improving a Roomba

Desining and programming a more inteligent Roomba using Machine learning.

Project details

Project type:
ECTS:
Time:
Client:
Nature:
Keywords:


Elective
3
2018/2019
TU Delft
Group Project
A* pathfinding, AI, Data, Genetic algorithm, Programming & Traveling Salesman Problem

Project type:
ECTS:
Time:
Client:
Nature:
Keywords:

Elective
3
2018/2019
TU Delft
Group Project
A* pathfinding, AI, Data, Genetic algorithm, Programming & Traveling Salesman Problem

Summary

The goal of this elective was to analyse the functionality and intelligence of a basic Roomba and to then redesign and improve this. To do so we modelled the behaviour inside of MATLAB. We then used this to create simulation inside of matlab to generated datasets of the Roomba. They consisted of data of the location of the roomba, and the amount of dirt it collected on each location. After collecting the data we split up. My groupmenbers set out to use these data sets as input for machine learning to generate maps of a room with hotspots of dirt. I then used their maps to generate an effictient route for the roomba to take inbetween each dirt hotspot. This allowed to roomba to more efficiently clean the room.

Understanding the Roomba

At the beginning of the project the goal was to understand the roomba and create a simulation of the roomba inside of matlab. To do so we learned the basic of simulink, simscape and control logic. We also played around and tried different contorl logics for the roomba. Next to simulation we also trested how the actual roomba collectects data. Here we did an expirement gathering the position and dirt data from the Roomba. Using the simulations we created data sets of the roomba running in the room and colecting data on the location of the room and the amount of dirt on each location

Optimizing

Having generated the data we set out to optimize the Roomba. To do so we wanted to create a map of how the room looks, what hotspots of the dirt are and how they changed throughout the week. With that map, we wanted to create an optimal route for the Roomba to run sometimes to only clean the hotspots of dirt and do a full clear of the room once a week. Making the Roomba overall more efficient and effective. 
To do so we split up the work, my group mates set out to create the maps using classification learning, fitting neural networks and time series neural networks. I set out to generate the optimal path for the Roomba to take through a certain room.

A* search algorithm

As a first step towards creating an optimal path through a room was to determine the quickest path between each spot. To do so I implementen an A* search alogrithm in MATLAB. Then I let it run and determine the shortest path inbetween each hotspot of dirt.

Genetic Algorithm

Having generated data on the distance between each point, the optimal order of points to visit needed to be determined, the travelling salesman problem. To attack this problem I programmed a genetic algorithm inside of MATLAB and let it run to generate the optimal path between all the points.

Disco Wheelchair

Disco Wheelchair

Designing a wheelchair that is the centre of attention at a party by connecting the wheelchair to the music and lights.

Project details

Project type:
ECTS:
Time:
Client:
Nature:
Link:
Keywords:


Elective
3
2019
TU Delft
Group Project
GitHub
AI, Data, Programming & Prototyping

Project type:
ECTS:
Time:
Client:
Nature:
Link:
Keywords:

Elective
3
2019
TU Delft
Group Project
GitHub
AI, Data, Programming & Prototyping

Summary

The goal of this elective was to create a working prototype of an IoT product. As a product, we were given a wheelchair. We specified this to a wheelchair that allows children to become the centre of the party. We envisioned a wheelchair which could control the music similarly to how a DJ could control the music. In this project, we created a working prototype of a wheelchair which could pause, play and skip tracks, adjust the play speed, and high and low pass filters. The input for these controls is based on gestures and postures. For the gestures a adafruit gesture sensor was used. For the postures, several pressure sensors (FSR) were used. The presure from each sensor was used as input for a classifiaction algorithm created through machine learning.

Sensors, Actuators & Controllers

At the centre of the electronics in the wheelchair lays an Arduino mega and a Raspberry pi. The Arduino is a microcontroller and is the interface between all the sensors and the LED strip. The Raspberry Pi is a single-board computer and is used for the more computational intensive processes such as playing and adjusting music and running the classification algorithm. Connected to Arduino are a led strip and all the sensors: a microphone, a  proximity sensor, a gesture sensor and 4 pressure sensors. Connected to the Raspberry Pi is a speaker.

The music

To play and manipulate the music we used Pure Data on the Raspberry Pi. Pure Data is a visual open-source programming language for multimedia. It gives us basic music controls, such as pause, play, forwards and backwards but also more advanced such as speeding up or slowing down the music and adding low and high pass filters.  Pure Data receives its command to apply these controls through TCP communication from a python script that is also running on the Rapsberry Pi. This python script gets input form the adruino through the serial port uses this to determine what commands to send to Pure Data.

Proximity sensor

The proximity sensor is a SHARP 2Y0A02 and is used to determine whether somebody is close to the wheelchair. It is connected to the Arduino which preforms a bit of processing, translating the voltage values to a distance in cm. The Arduino then sends this data to the Raspberry Pi through the serial port. On the Raspberry Pi, the python script reads the serial port and uses the values to determine if sombody is close to the wheelchair. If that is the case is passes a command to Pure Data using TCP to add an sample on top of the music that is already playing.

Gesture sensor

To detect gestures the Adafruit APDS9960 is used. It is connected to the arduino and uses a library provided by adafruit. This library procces the input from the senors and classifies this into 4 gestures, up, down, left and right. These were then communicated to the raspberry through the serial port and passed along to Pure Data through TCP.

Pressure sensor

To determine the posture of the person sitting in the wheelchair, four pressures sensors were added to the sitting and back surface of the wheelchair. Each sensor is connected to the Arduino which passes the values along to the Raspberry Pi. On the Raspberry Pi, it passes the values to a trained classification algorithm determining the posture the person is currently sitting. The output of this algorithm is them again communicated to Pure Data to apply the appropriate commands.

Lights

To add ad bit of extra flair to the wheelchair we also added an LED strip. To control this strip we used a Sparkfun sound detector. This allowed us to detect the beat and use this to match it to the output of the LED strip, creating a disco like effect where the music and the lights are in sync.

Demonstration

Pam

Pam

The interactive bedside lamp

Project details

Project type:
ECTS:
Time:
Client:
Nature:
Keywords:


Elective
3
2019
TU Delft
Group Project
Design fiction, Interaction design, Interviews, Product design, Prototyping, User observations & UX

Project type:
ECTS:
Time:
Client:
Nature:
Keywords:

Elective
3
2019
TU Delft
Group Project
Design fiction, Interaction design, Interviews, Product design, Prototyping, User observations & UX

Summary

For the course, “interactive formgiving”, the assignment was to design an Object with Intent (OwI) through user research, prototyping and design fiction. OwI is a new perspective on smart objects (Rozendaal, Boon, & Kaptelinin, 2019). They are everyday objects that act as collaborative partners in human activity. The product we designed is an interactive bedside lamp that helps with smartphone usage at bedtime. This lamp does not tolerate the usage of a smartphone in bed and goes from being annoyed to aggressive and annoying.

Process

To design an OwI we utilised video and WoZ prototyping. This allowed us to create quick prototypes and test, enact and specify behaviour. This allowed us to design and intelligent product without having to actually program and create it. This process consisted of creating a first version of the product, testing it, and using the results to itterate and create a final video. 

Concept

To design this we first decided on a product and context. A bedside lamp that helps you with phone usage in bed. From there we looked at what behaviour characteristics the product should have. For this, we went with an overprotective girlfriend that is also demanding and aggressive. Based on these characteristics a storyboard, behaviour flow and an early prototype were created. This behaviour was then sketched out in a video.

Early prototype

This prototype was then used in a wizard of oz (WoZ) style user test. In this test, we enacted the behaviour of the product to see how users responded and find what kind of behaviour is desired. During this test, there was a dialogue between the users and the designers. During this, we went into specifics with regards to the behaviour and how the behaviour felt.

Final design

Based on the feedback from the users we iterated on the prototype and its behaviour. The behaviour was finetuned by creating a video of a scenario in which the object enacts its behaviour. Through the creation of the video, the behaviour became concrete and detailed. Sound effects were also added as an additional layer to further communicate and solidify the character of the bedside lamp.

Result

Graduation Project

The making of a smart pillow

Designing an object with intent through a data-enabled design process

Project details

Project type:
ECT:
Time:
Client:
Nature:
Grade:
Links:

Keywords:


Master Graduation
30
2019/2020
TU Delft
Individual Project
9.0
Tudelft repository, Dutch Design week
Co-Creation, Data visualisation, Desk research, Interviews, Product design, Programming, Prototyping, User observations & UX

Project type:
ECT:
Time:
Client:
Nature:
Grade:
Links:

Keywords:

Master Graduation
30
2019/2020
TU Delft
Individual Project
9.0
Tudelft repository, Dutch Design week
Co-Creation, Data visualisation, Desk research, Interviews, Product design, Programming, Prototyping, User observations & UX

Summary

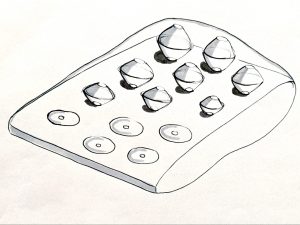
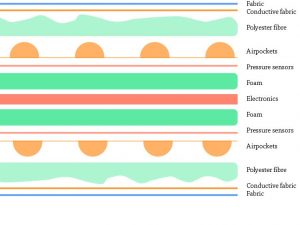
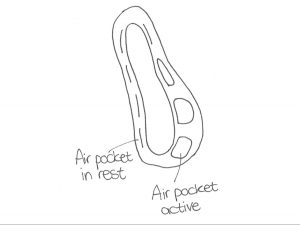
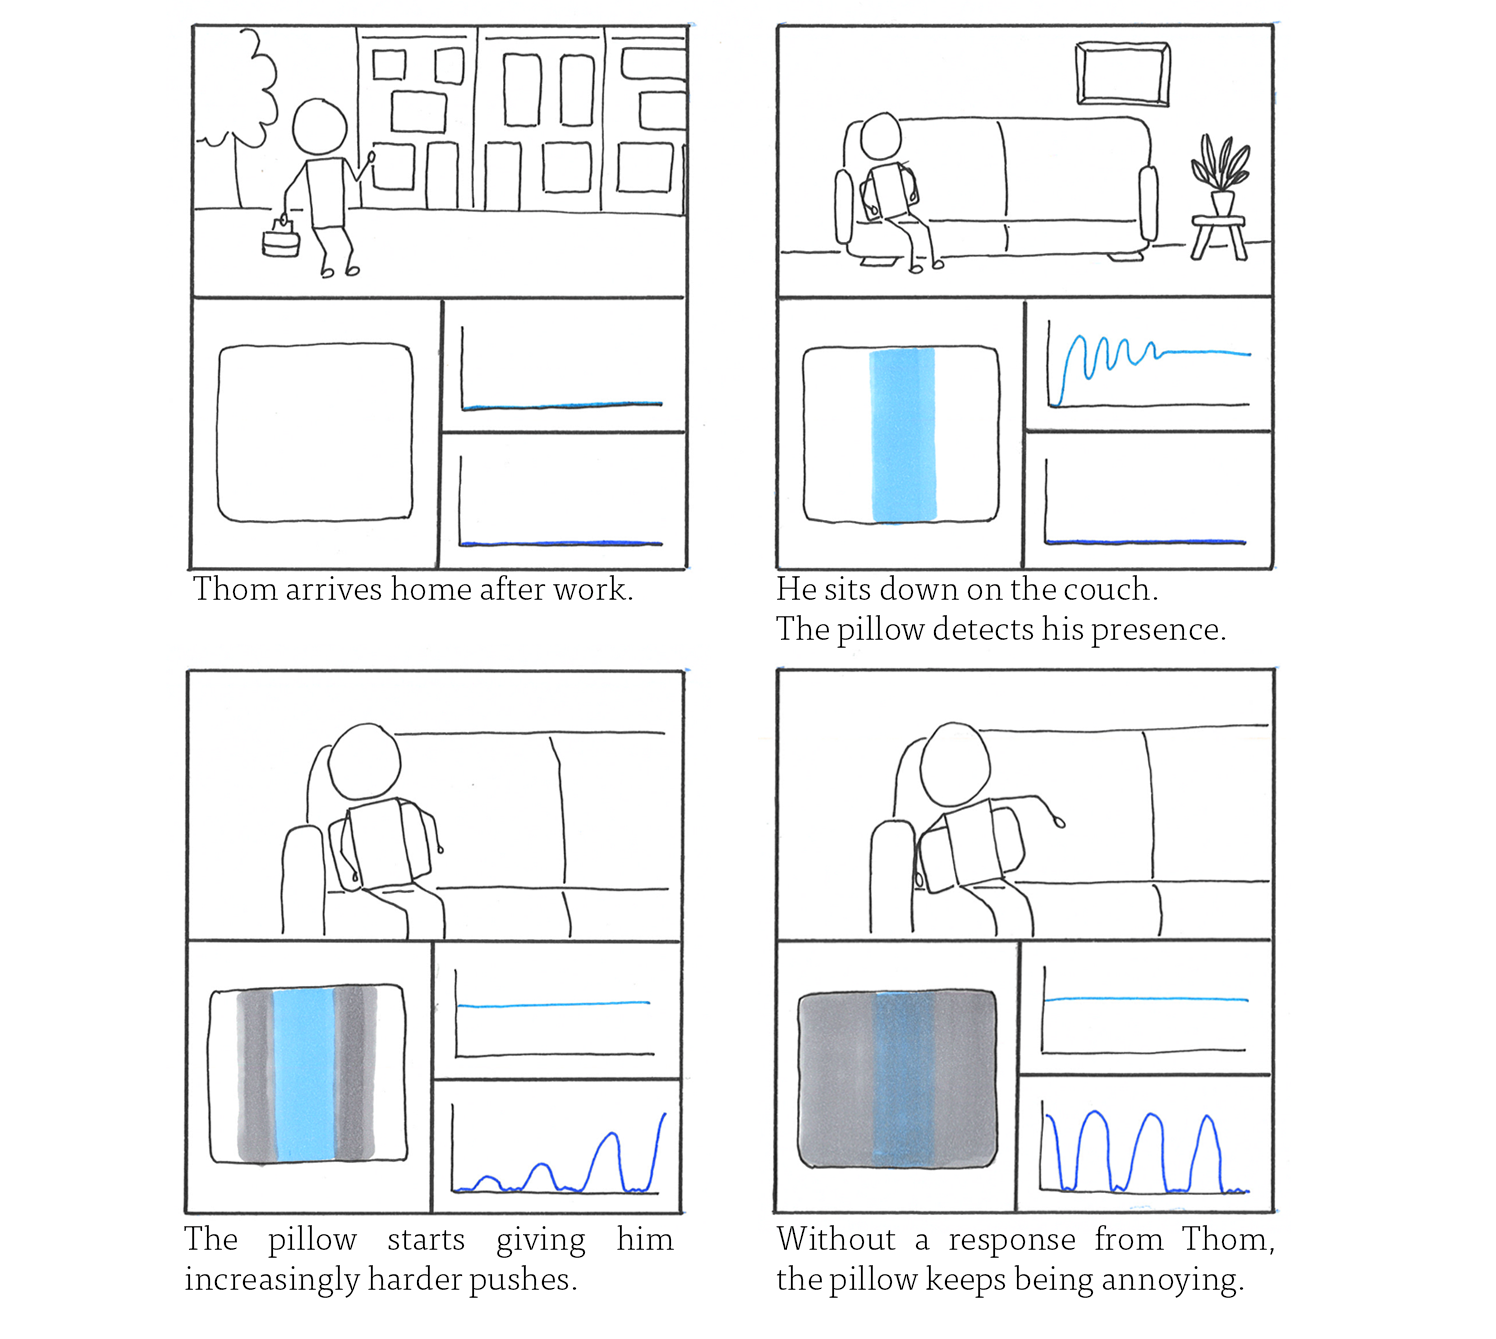
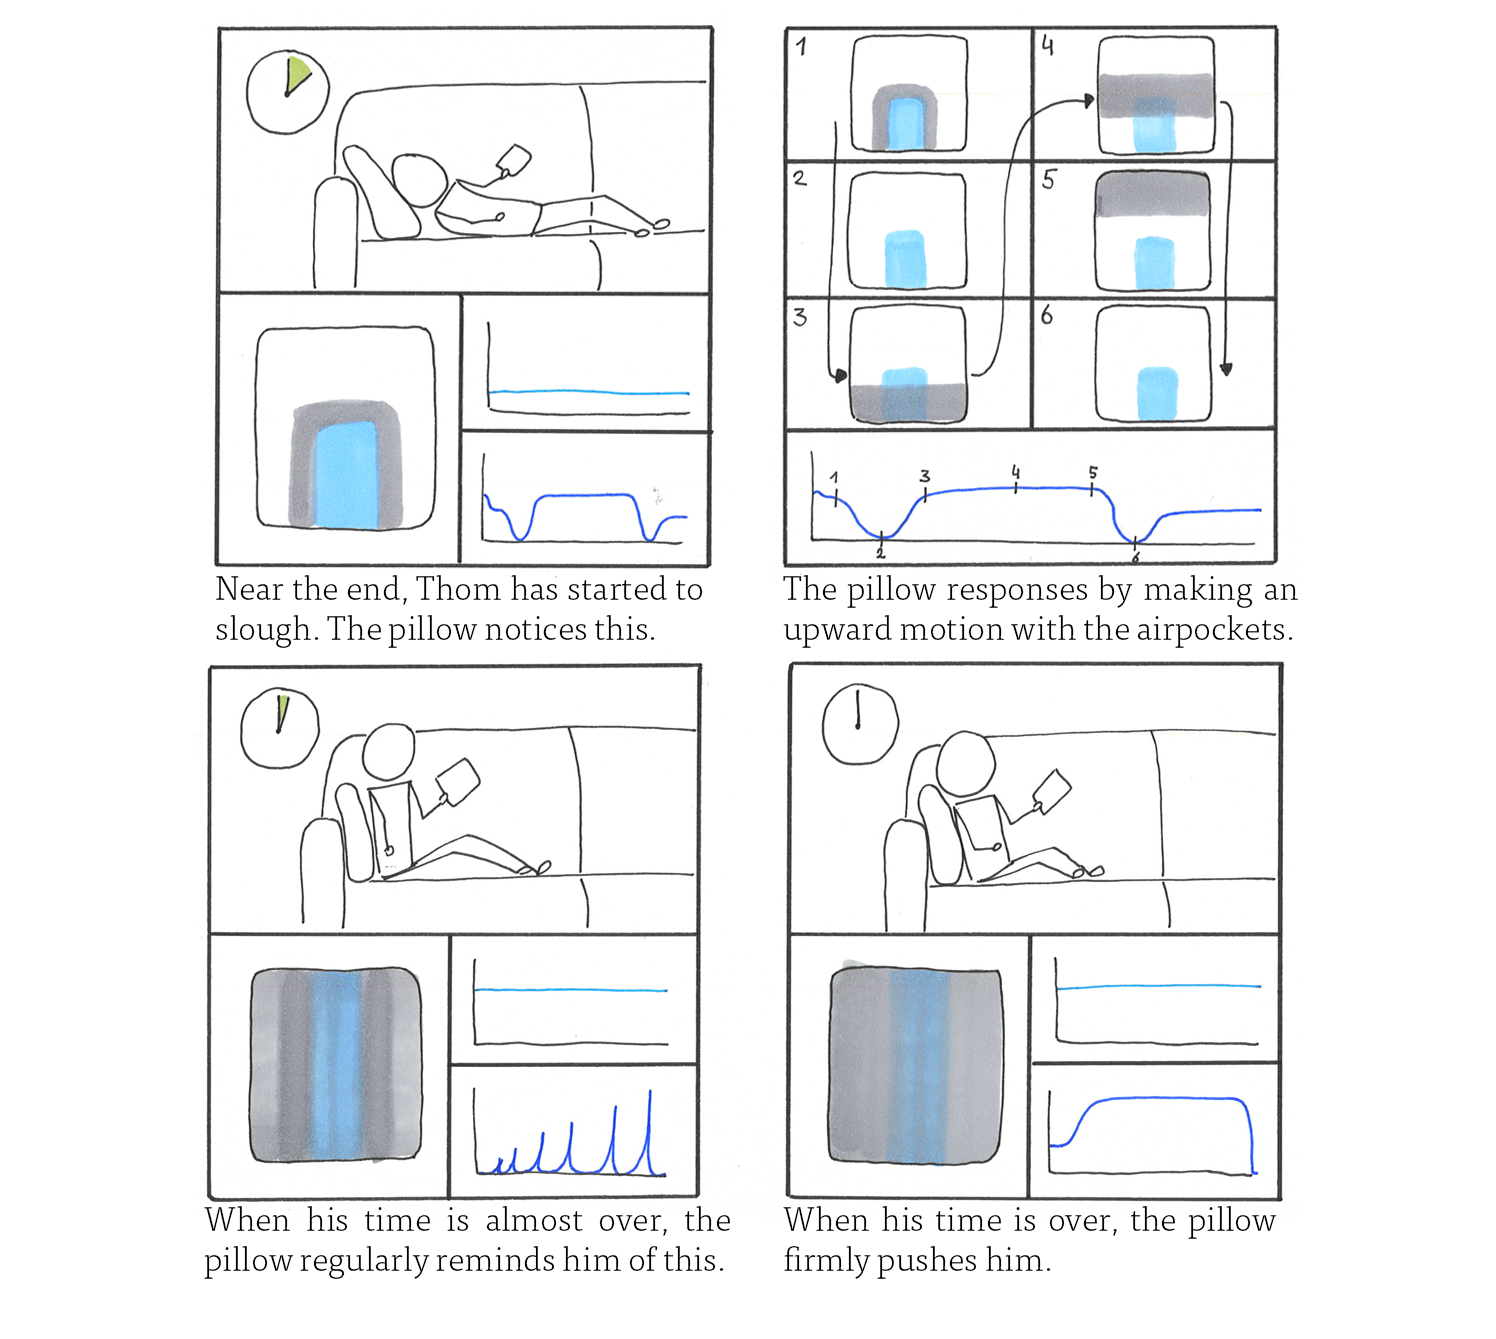
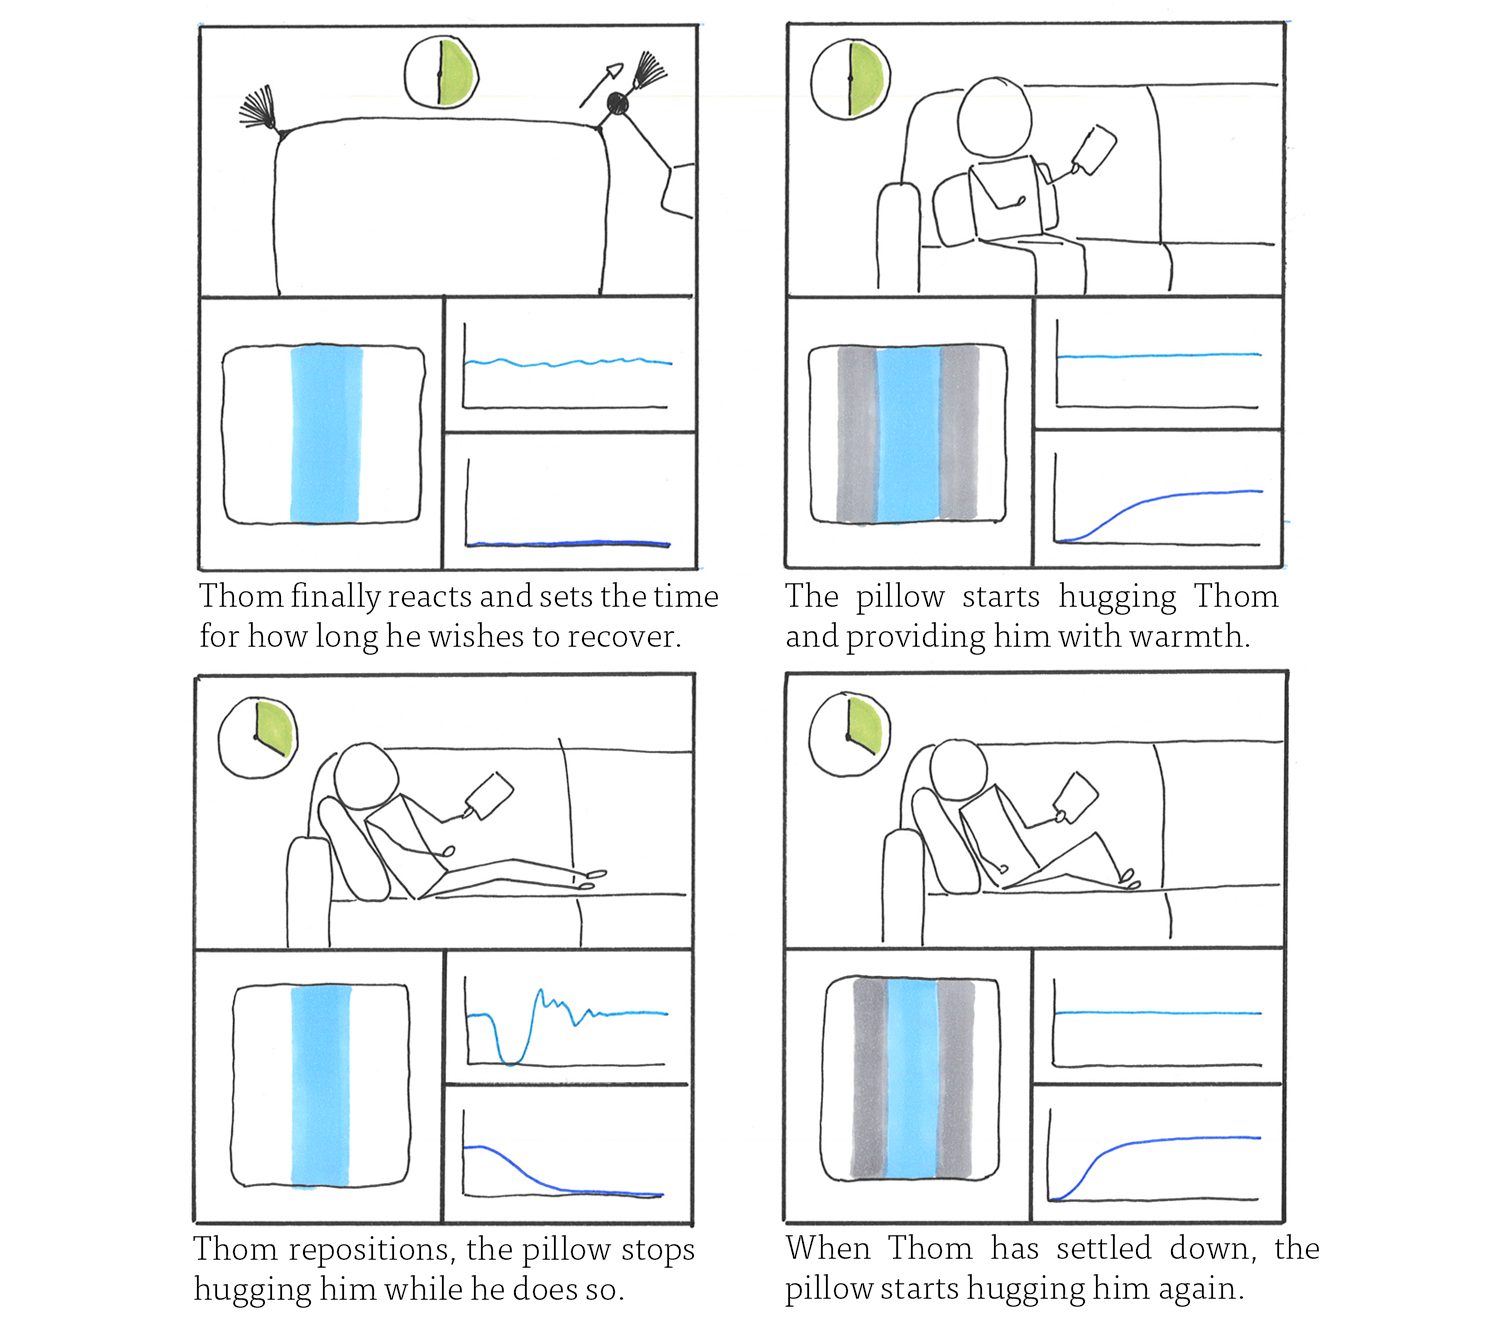
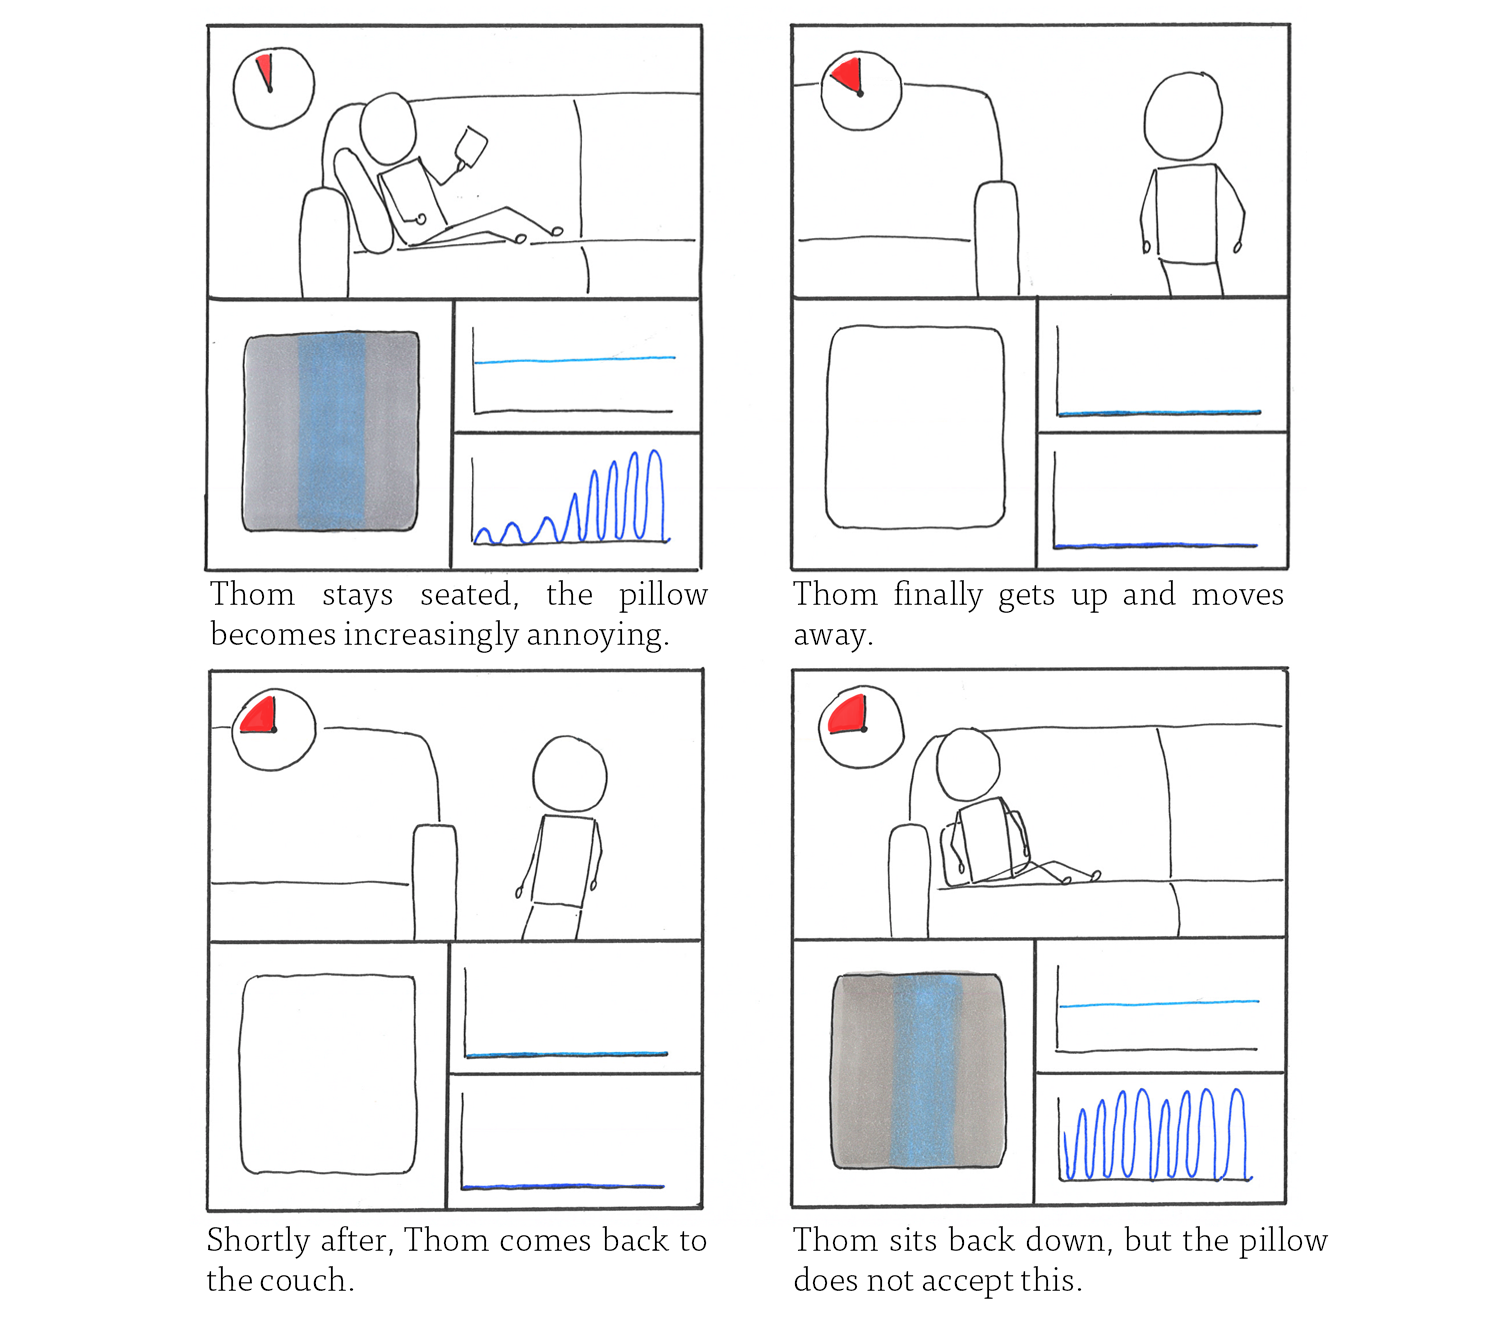
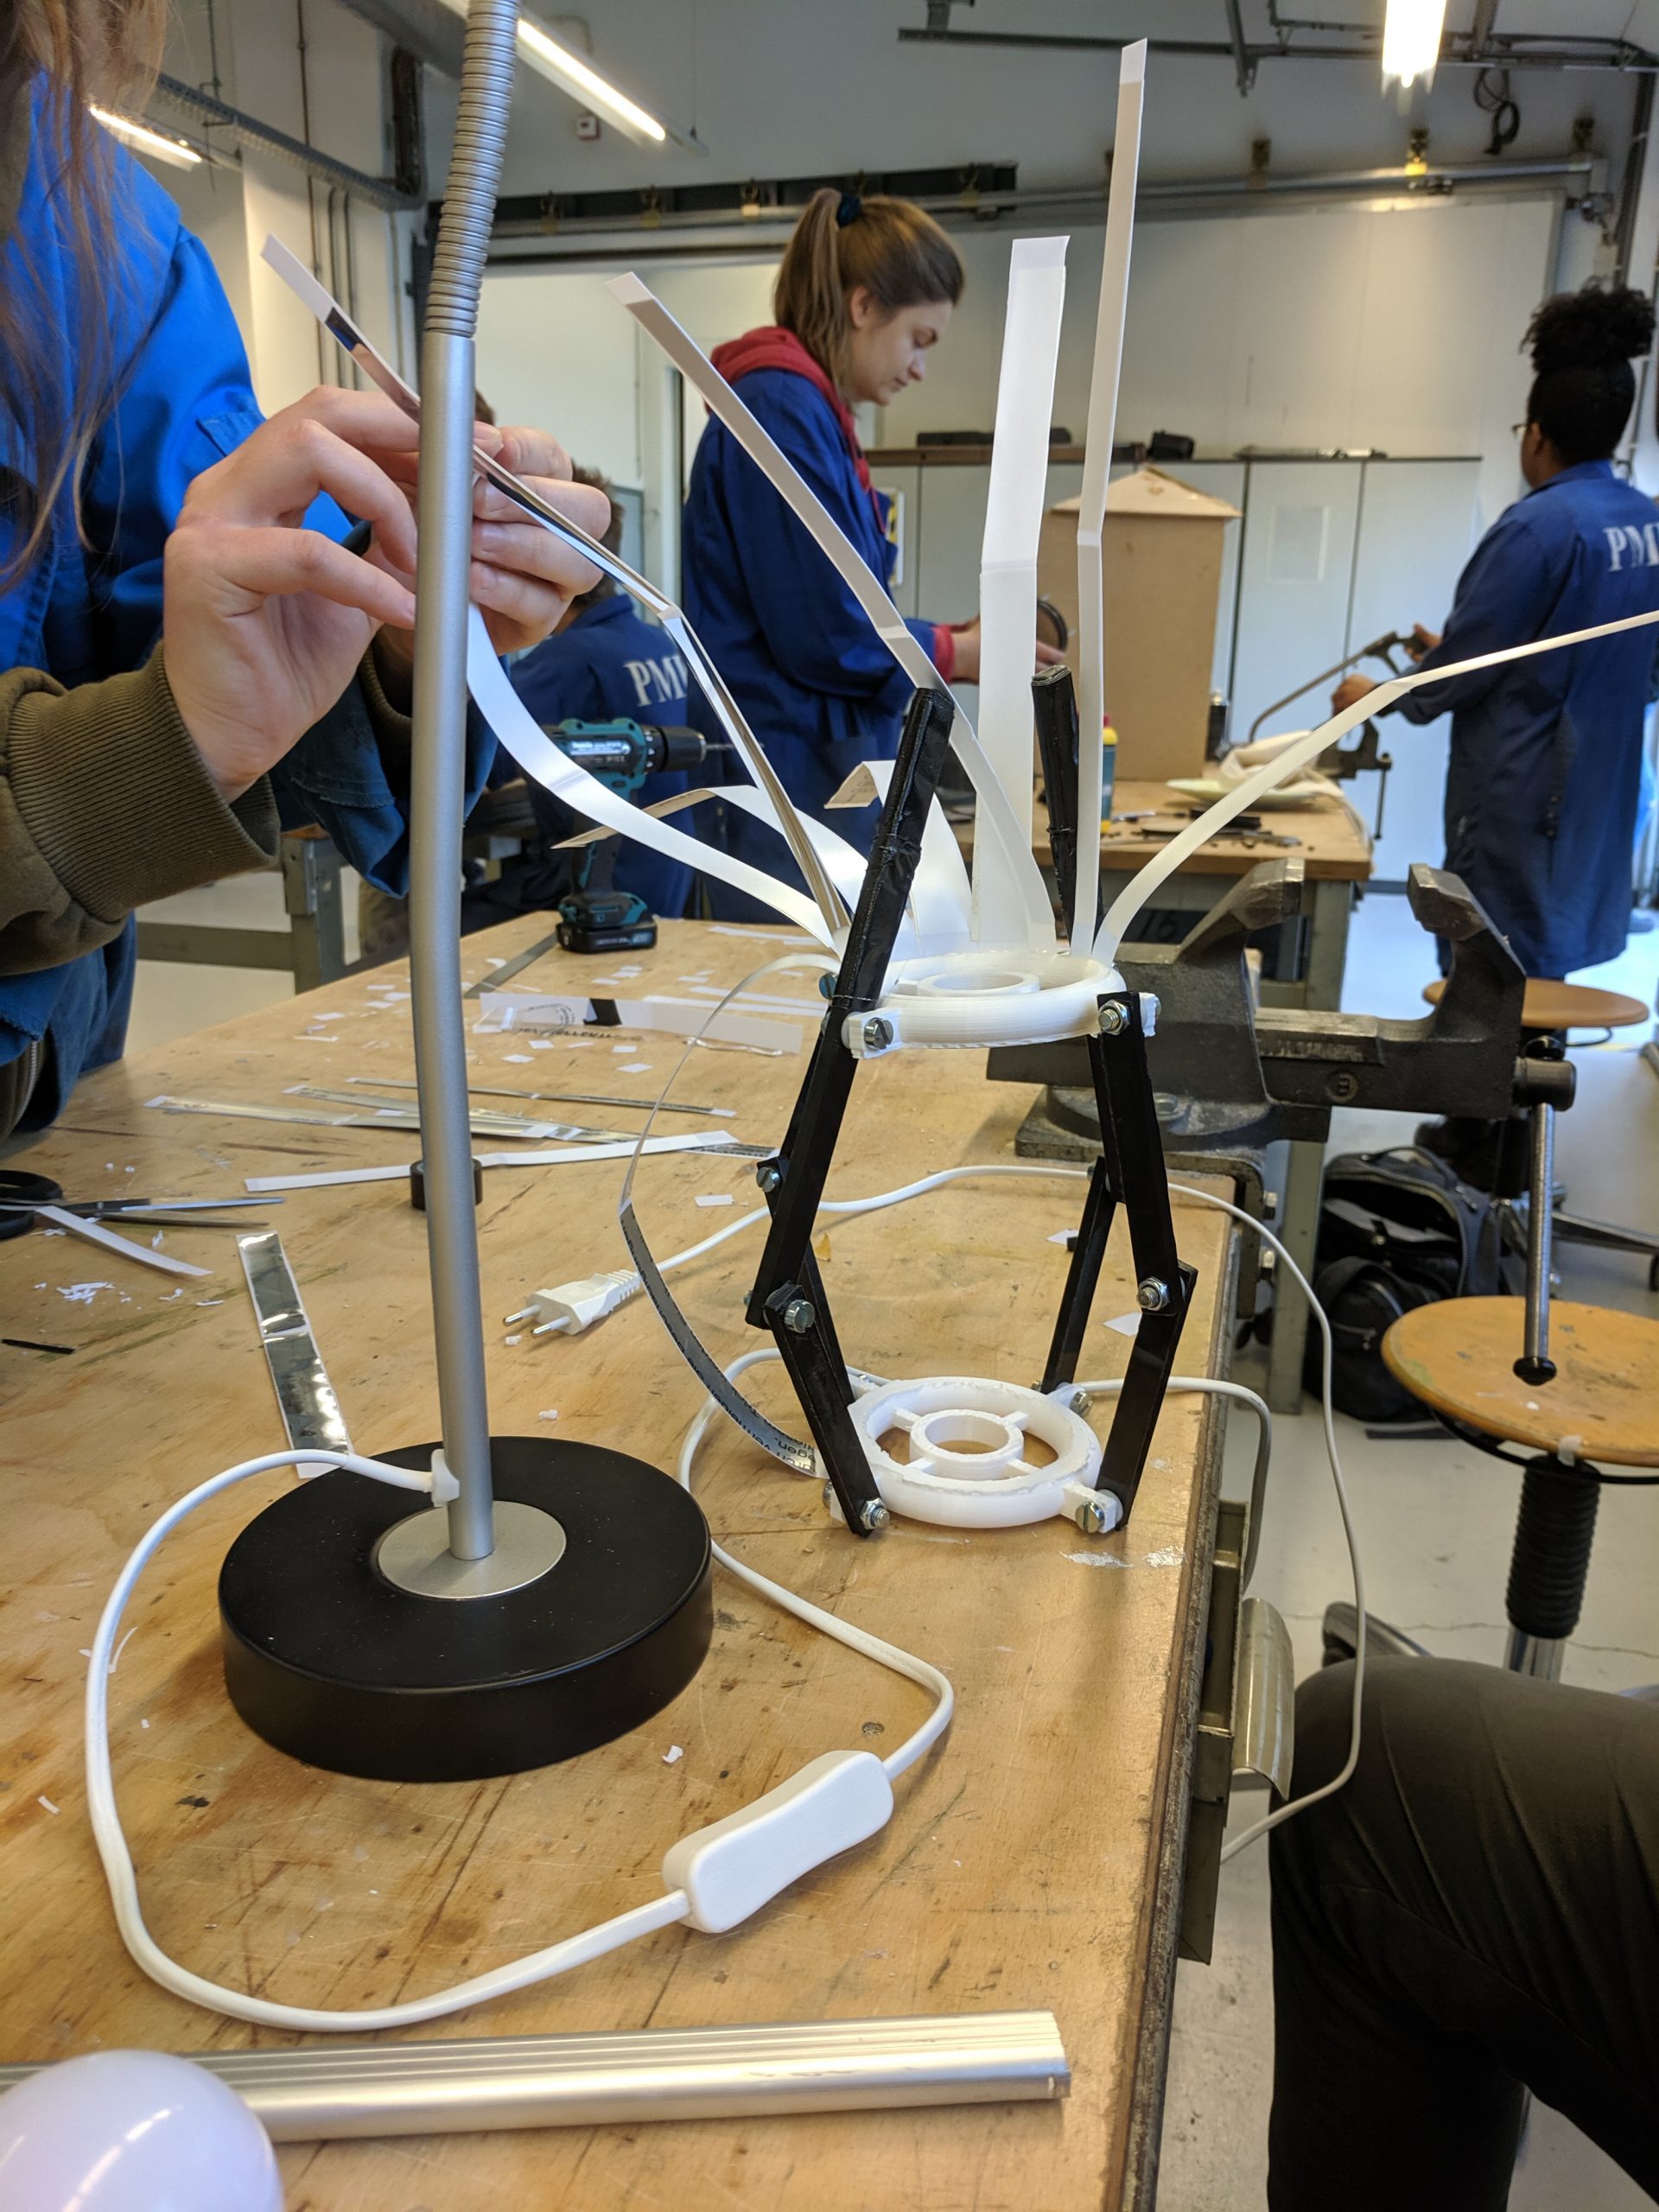
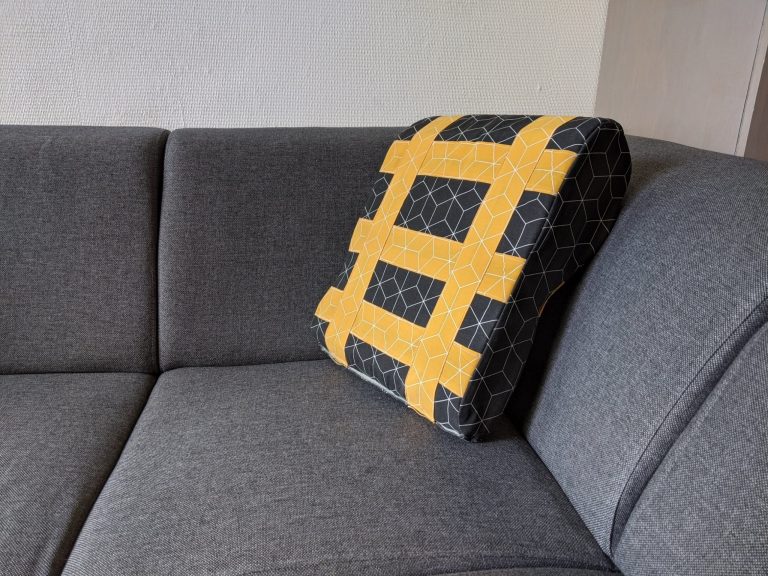
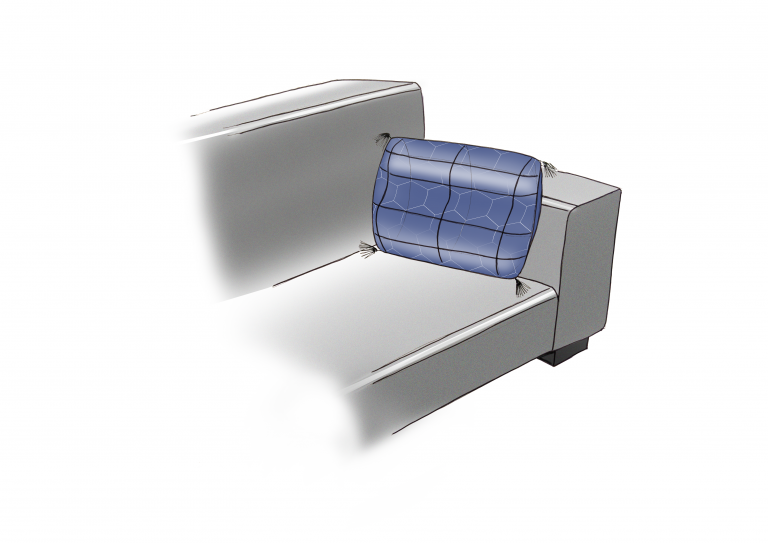
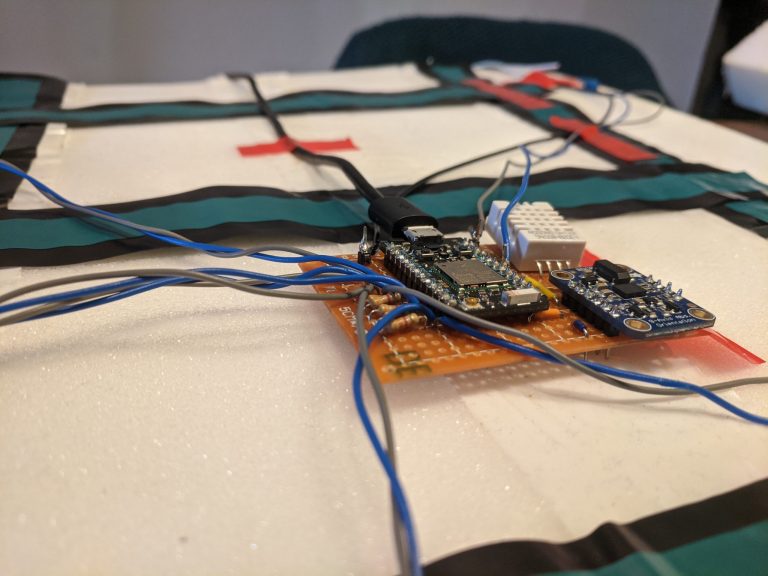
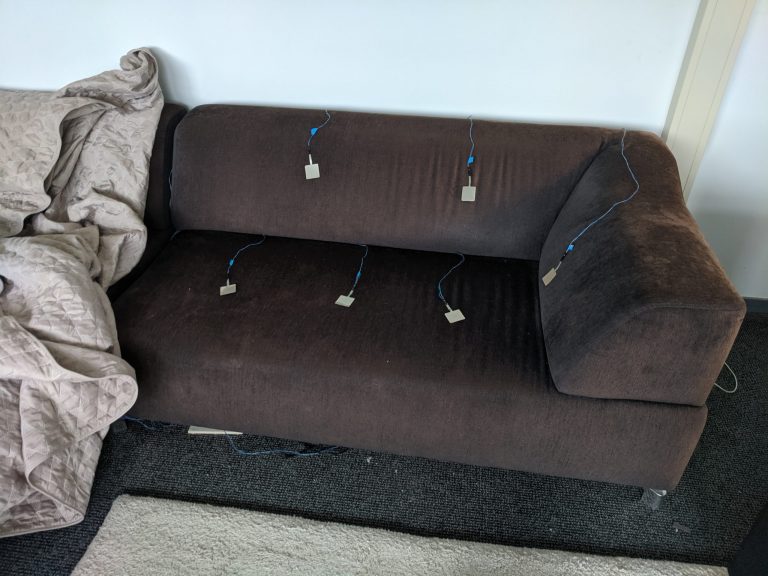
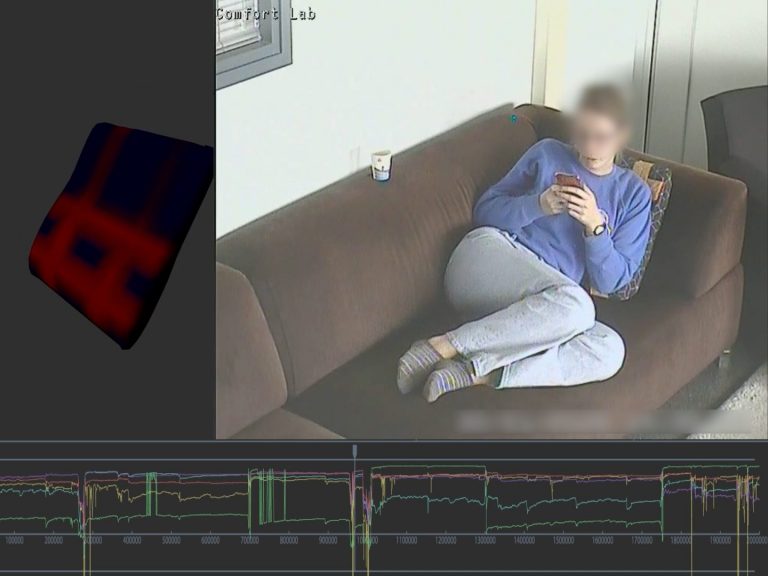
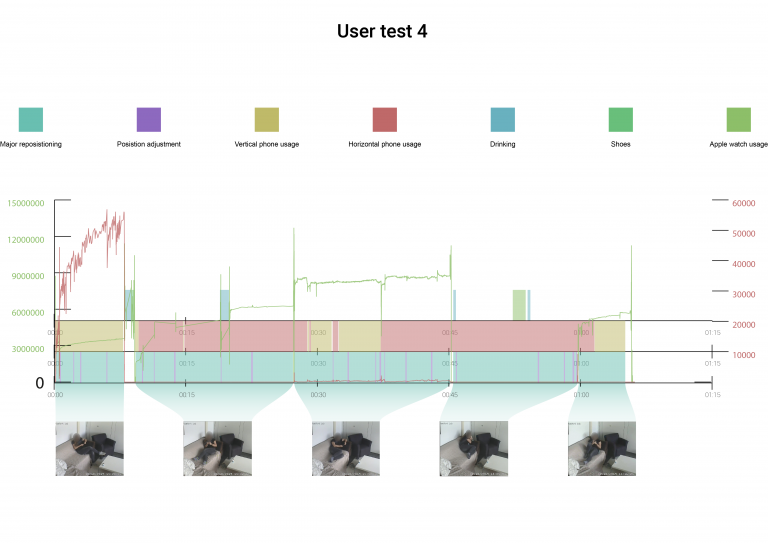
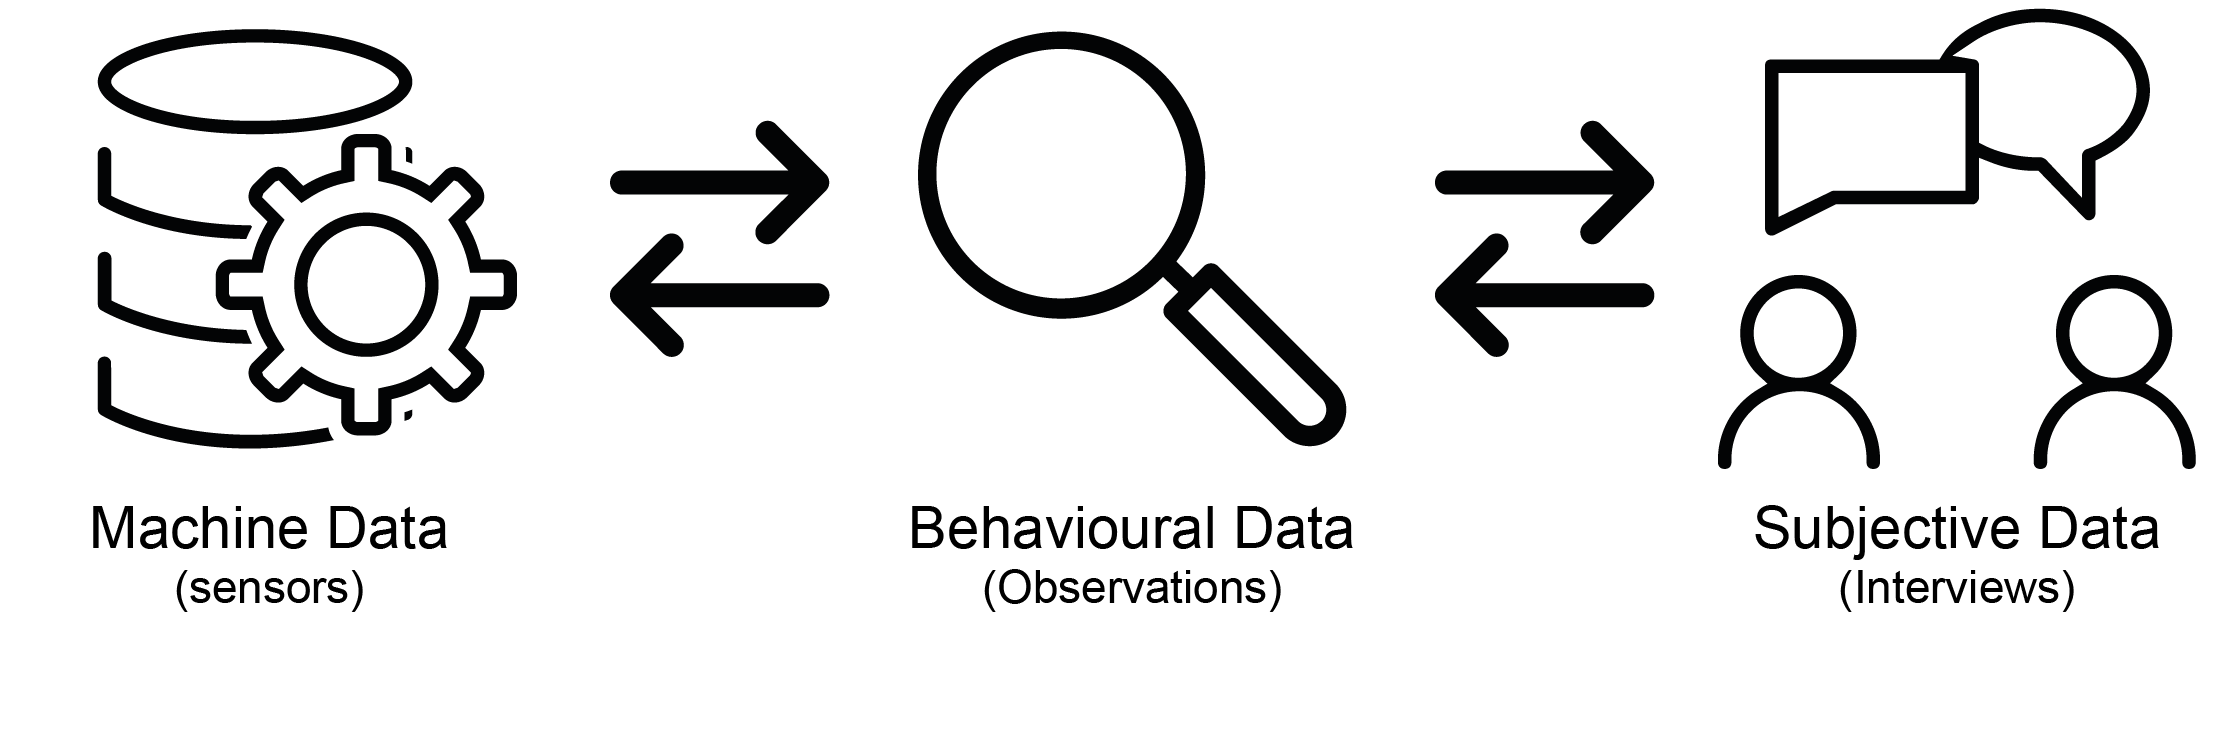
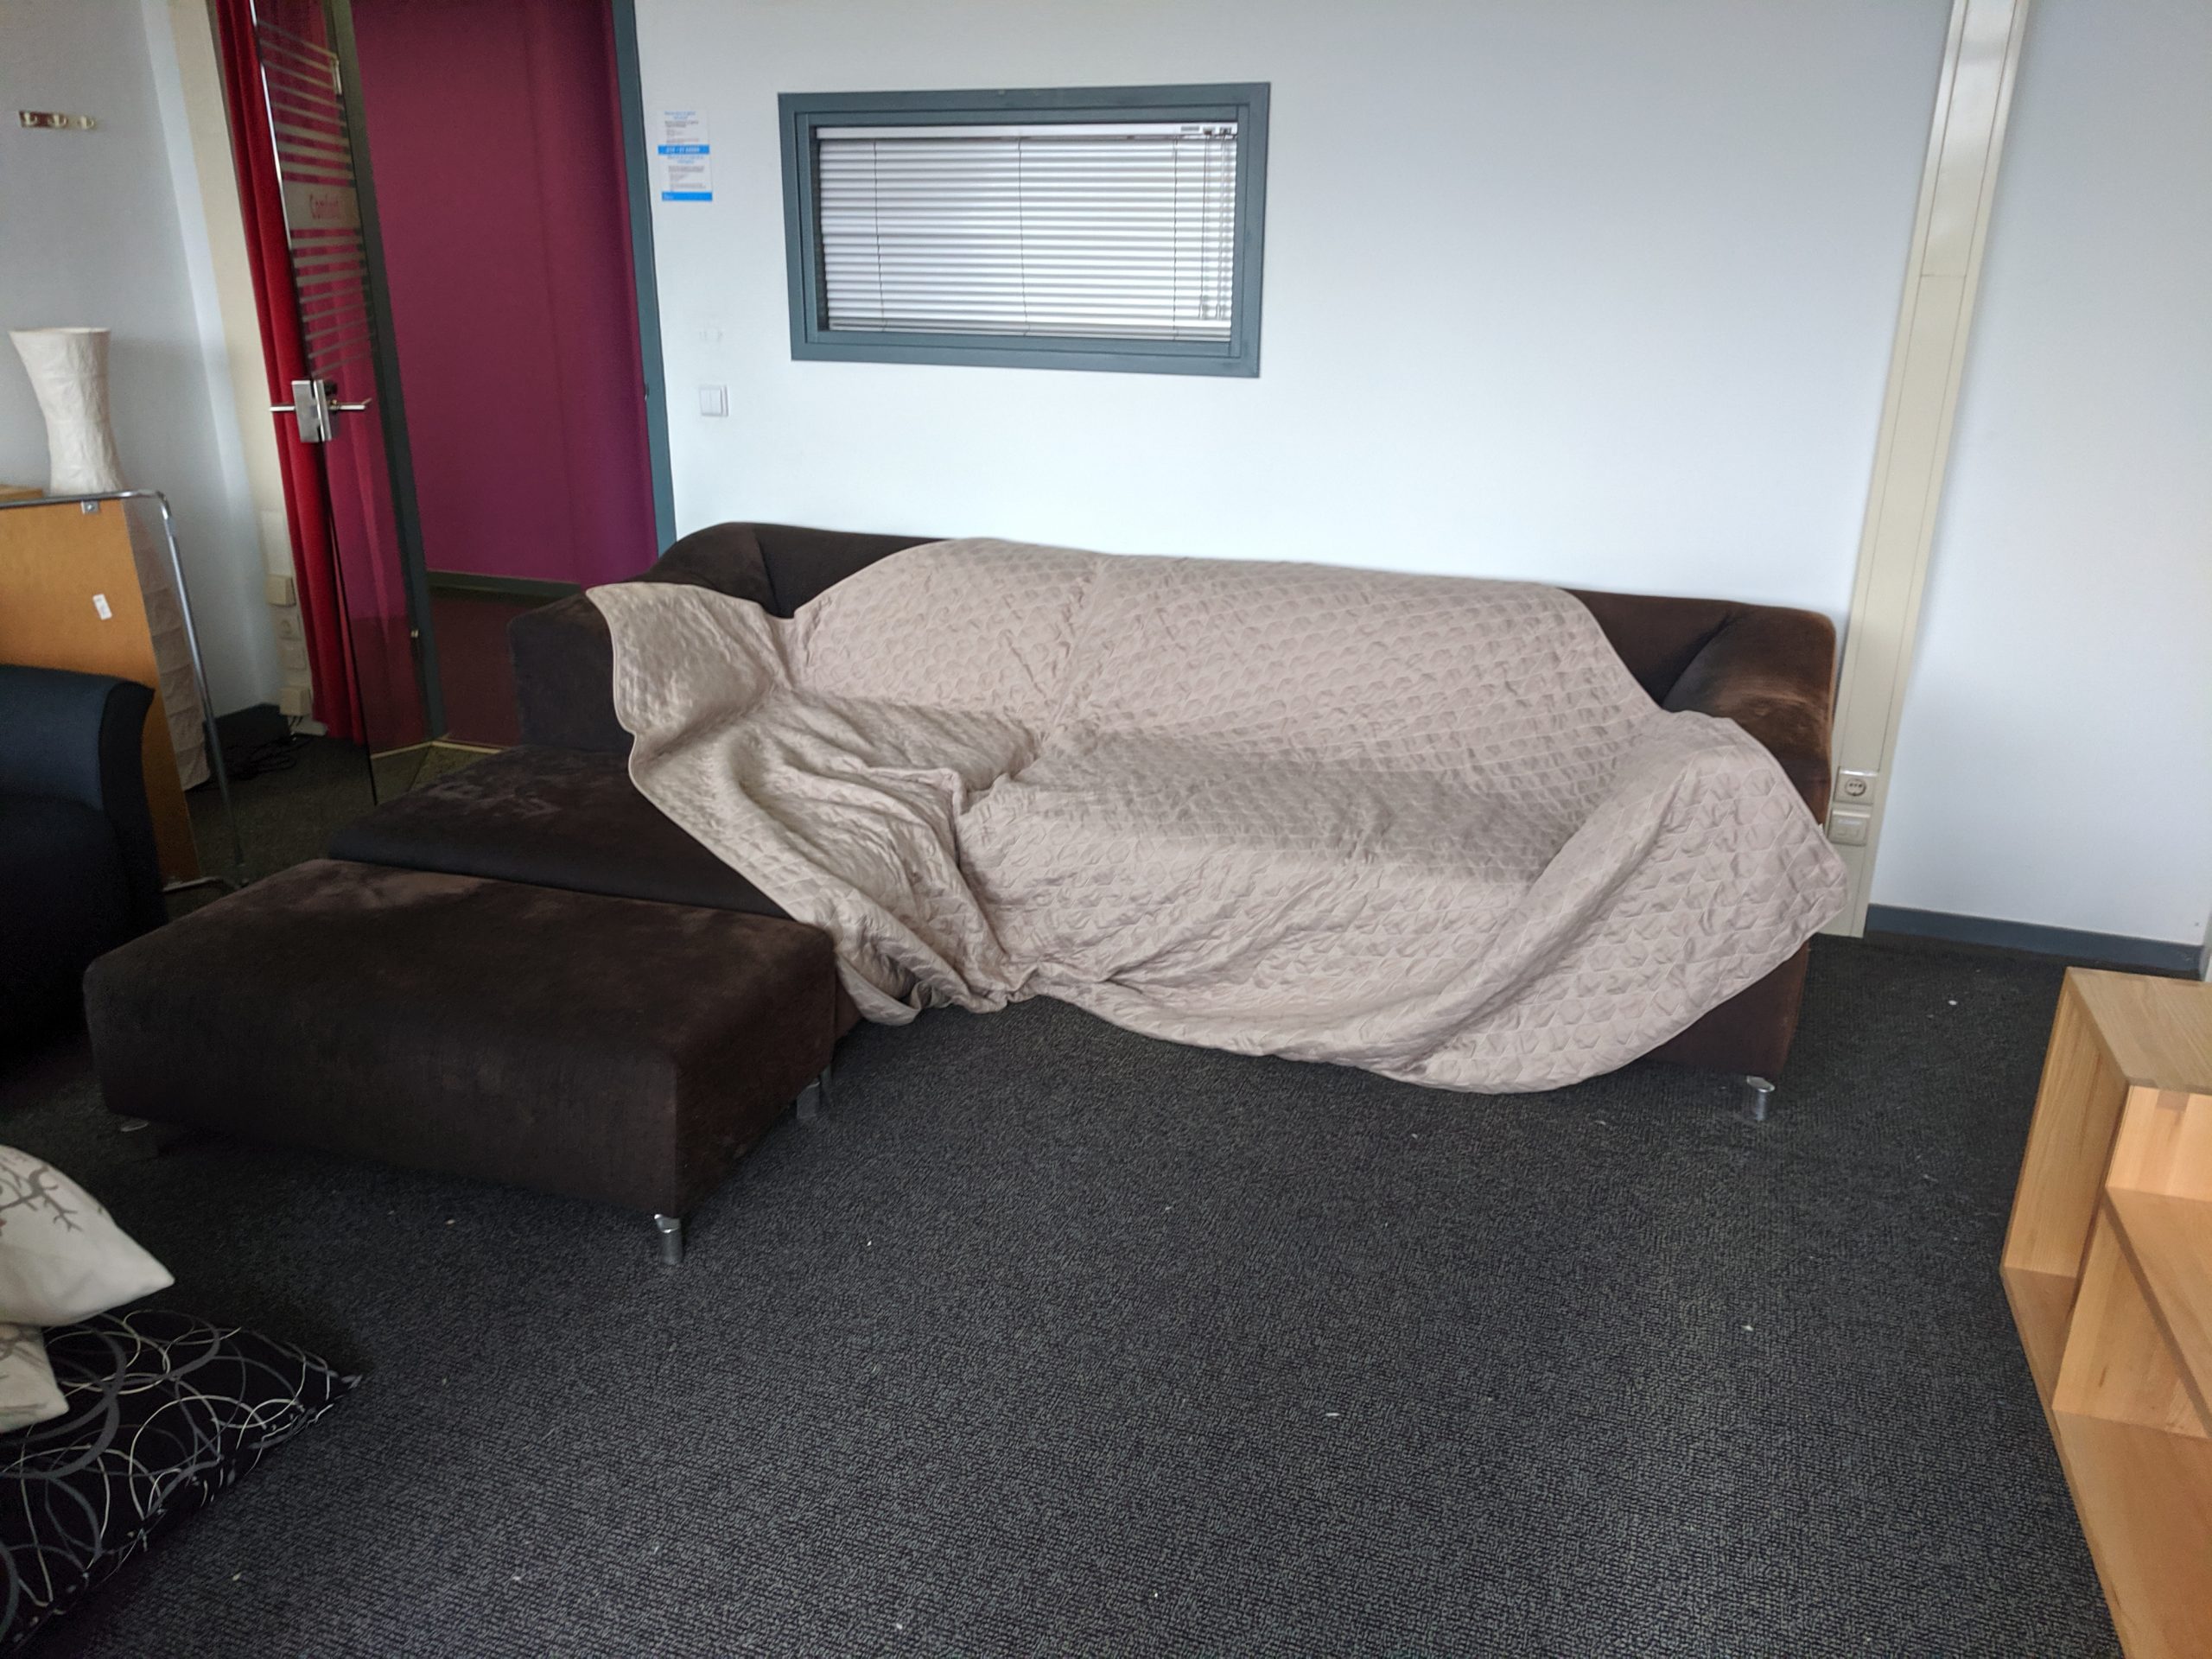
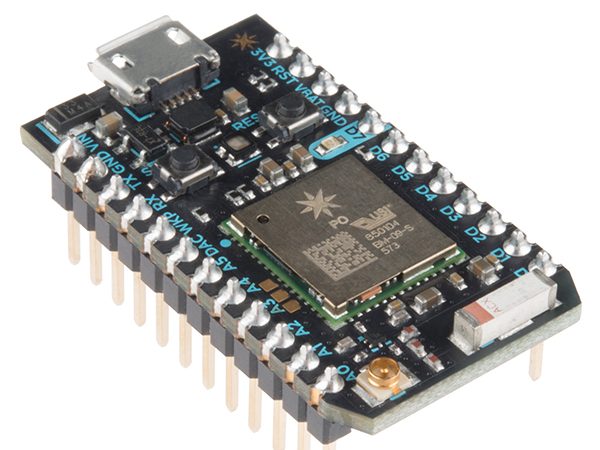
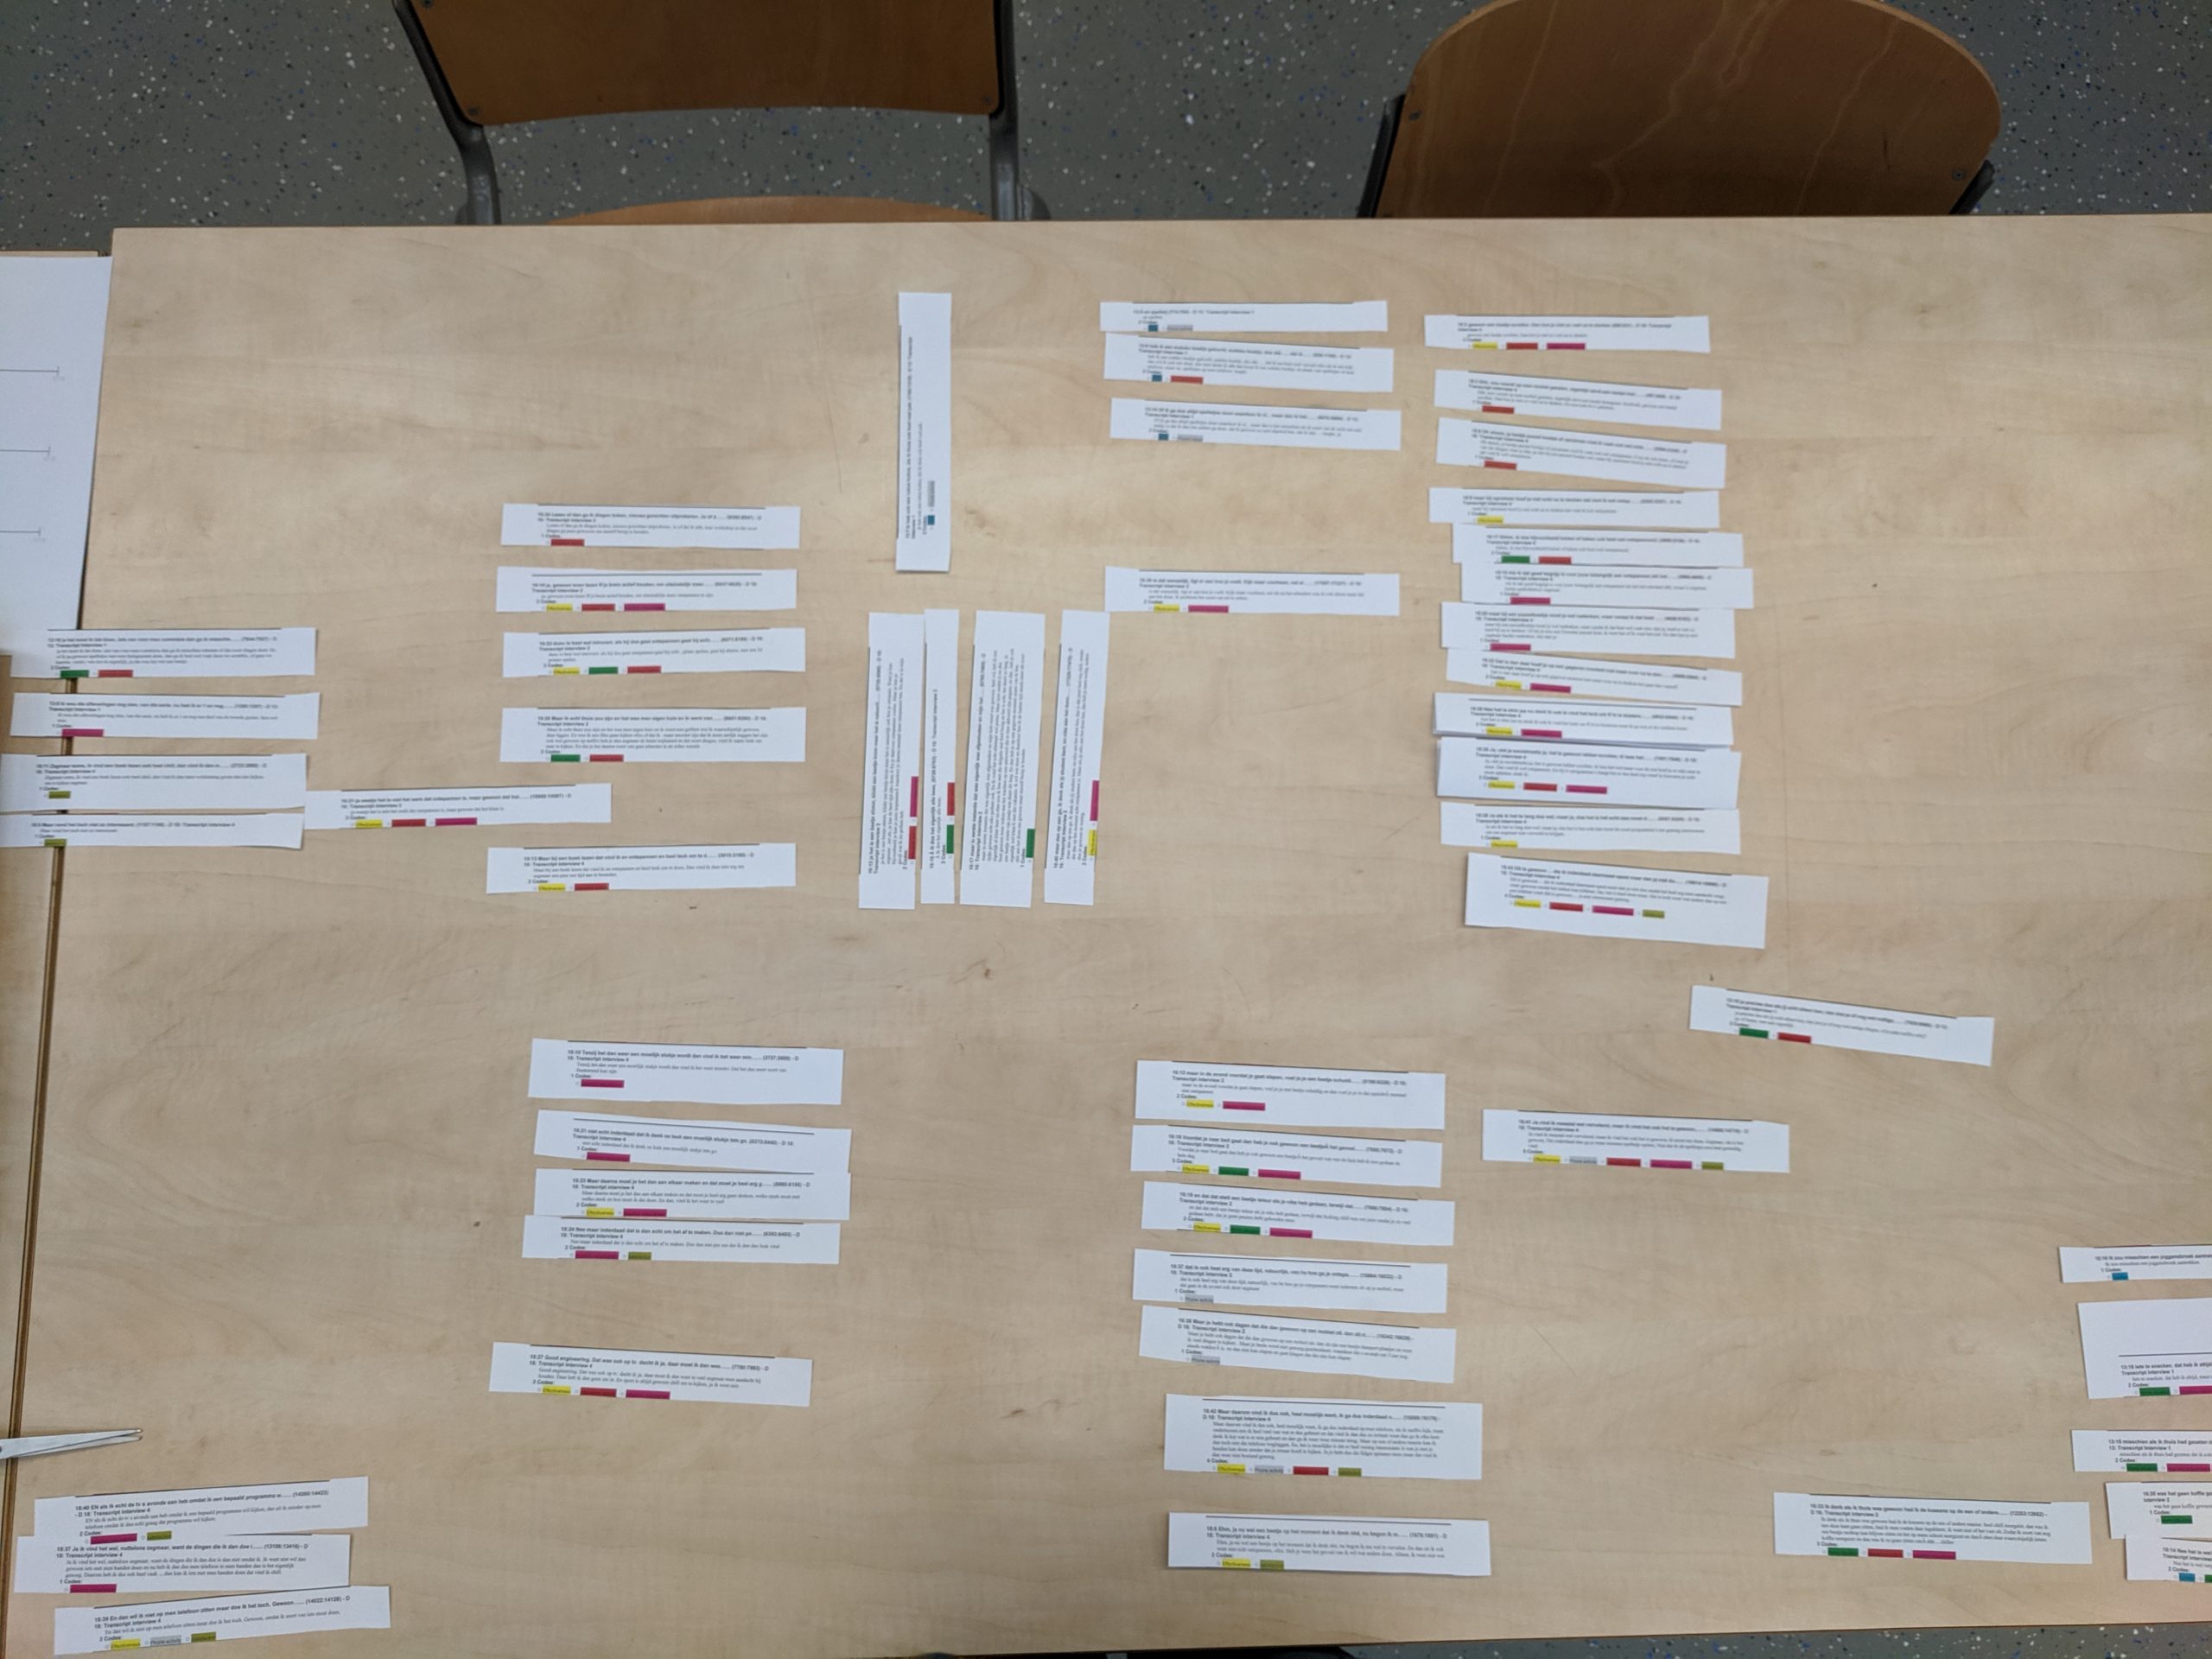
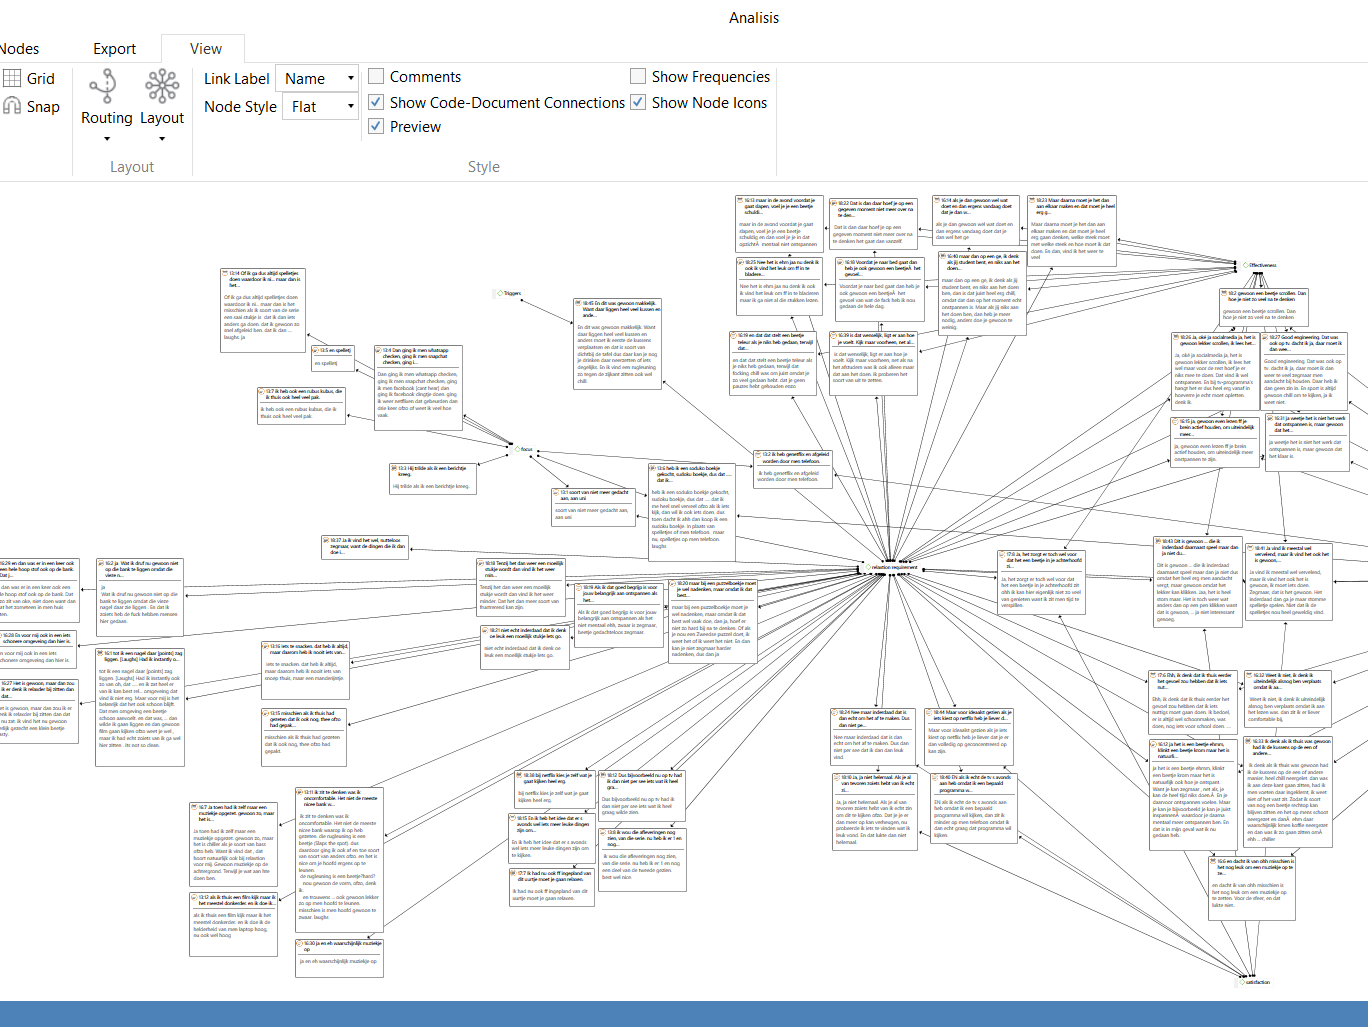
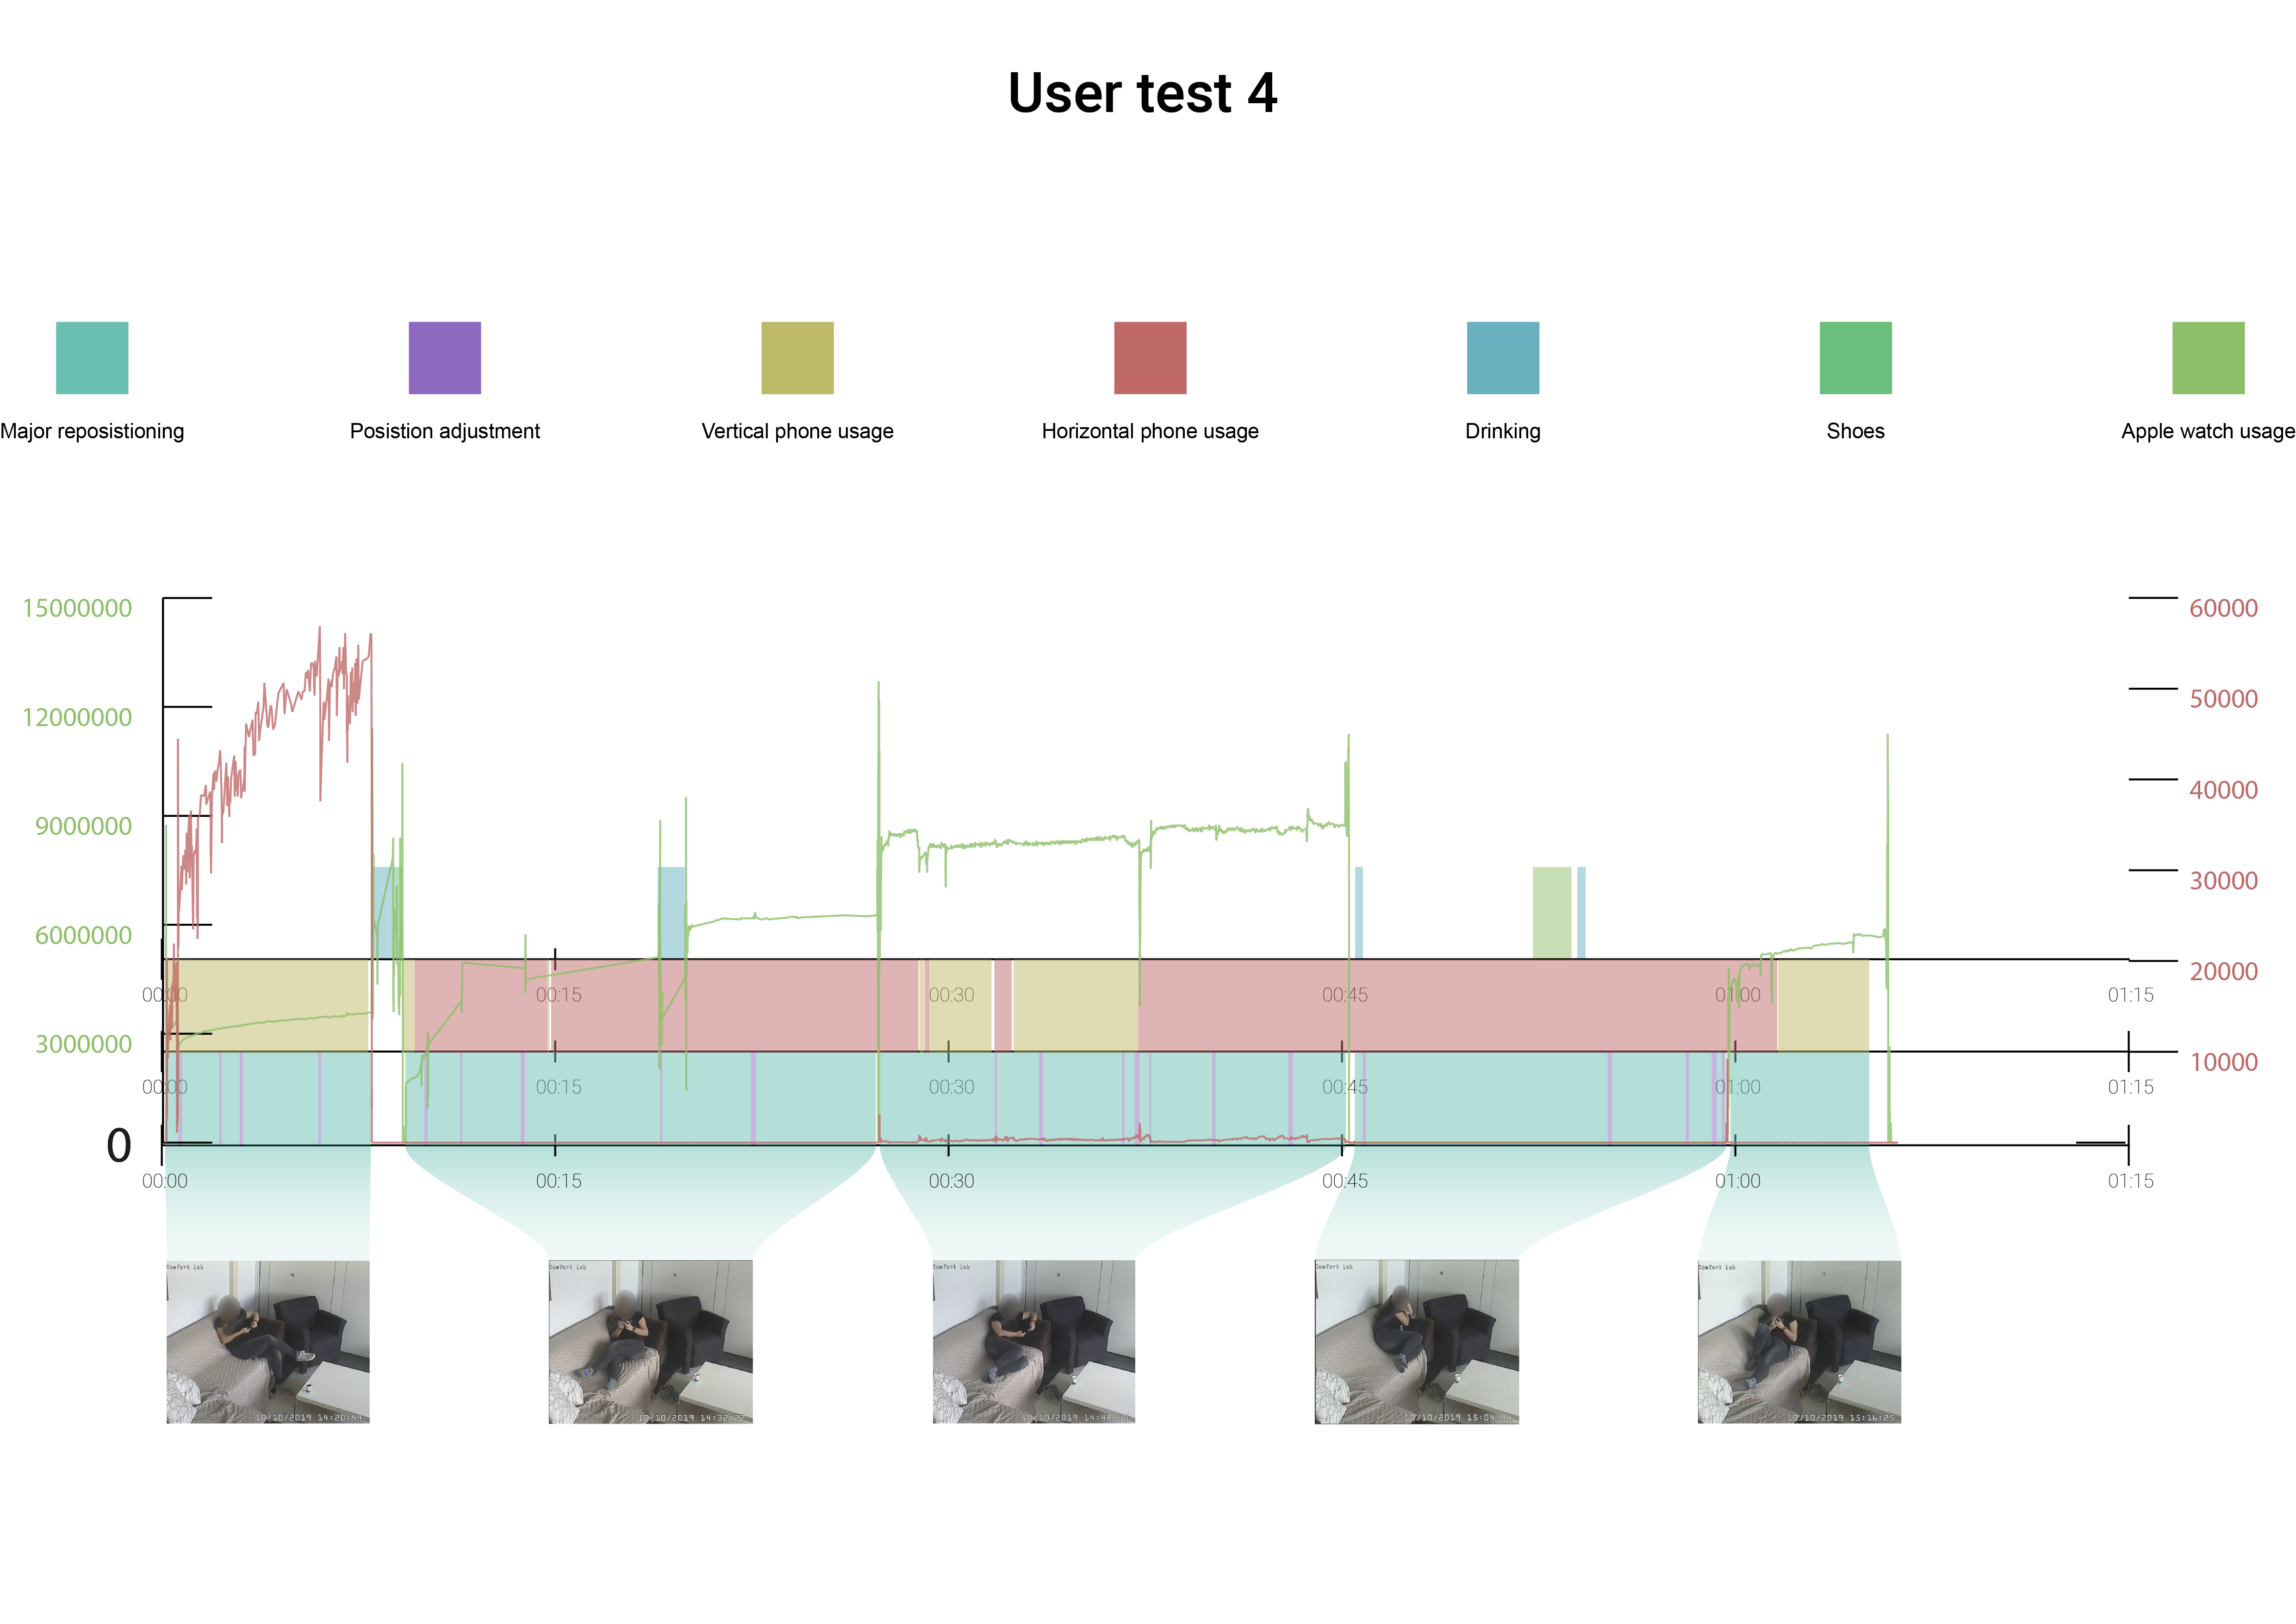
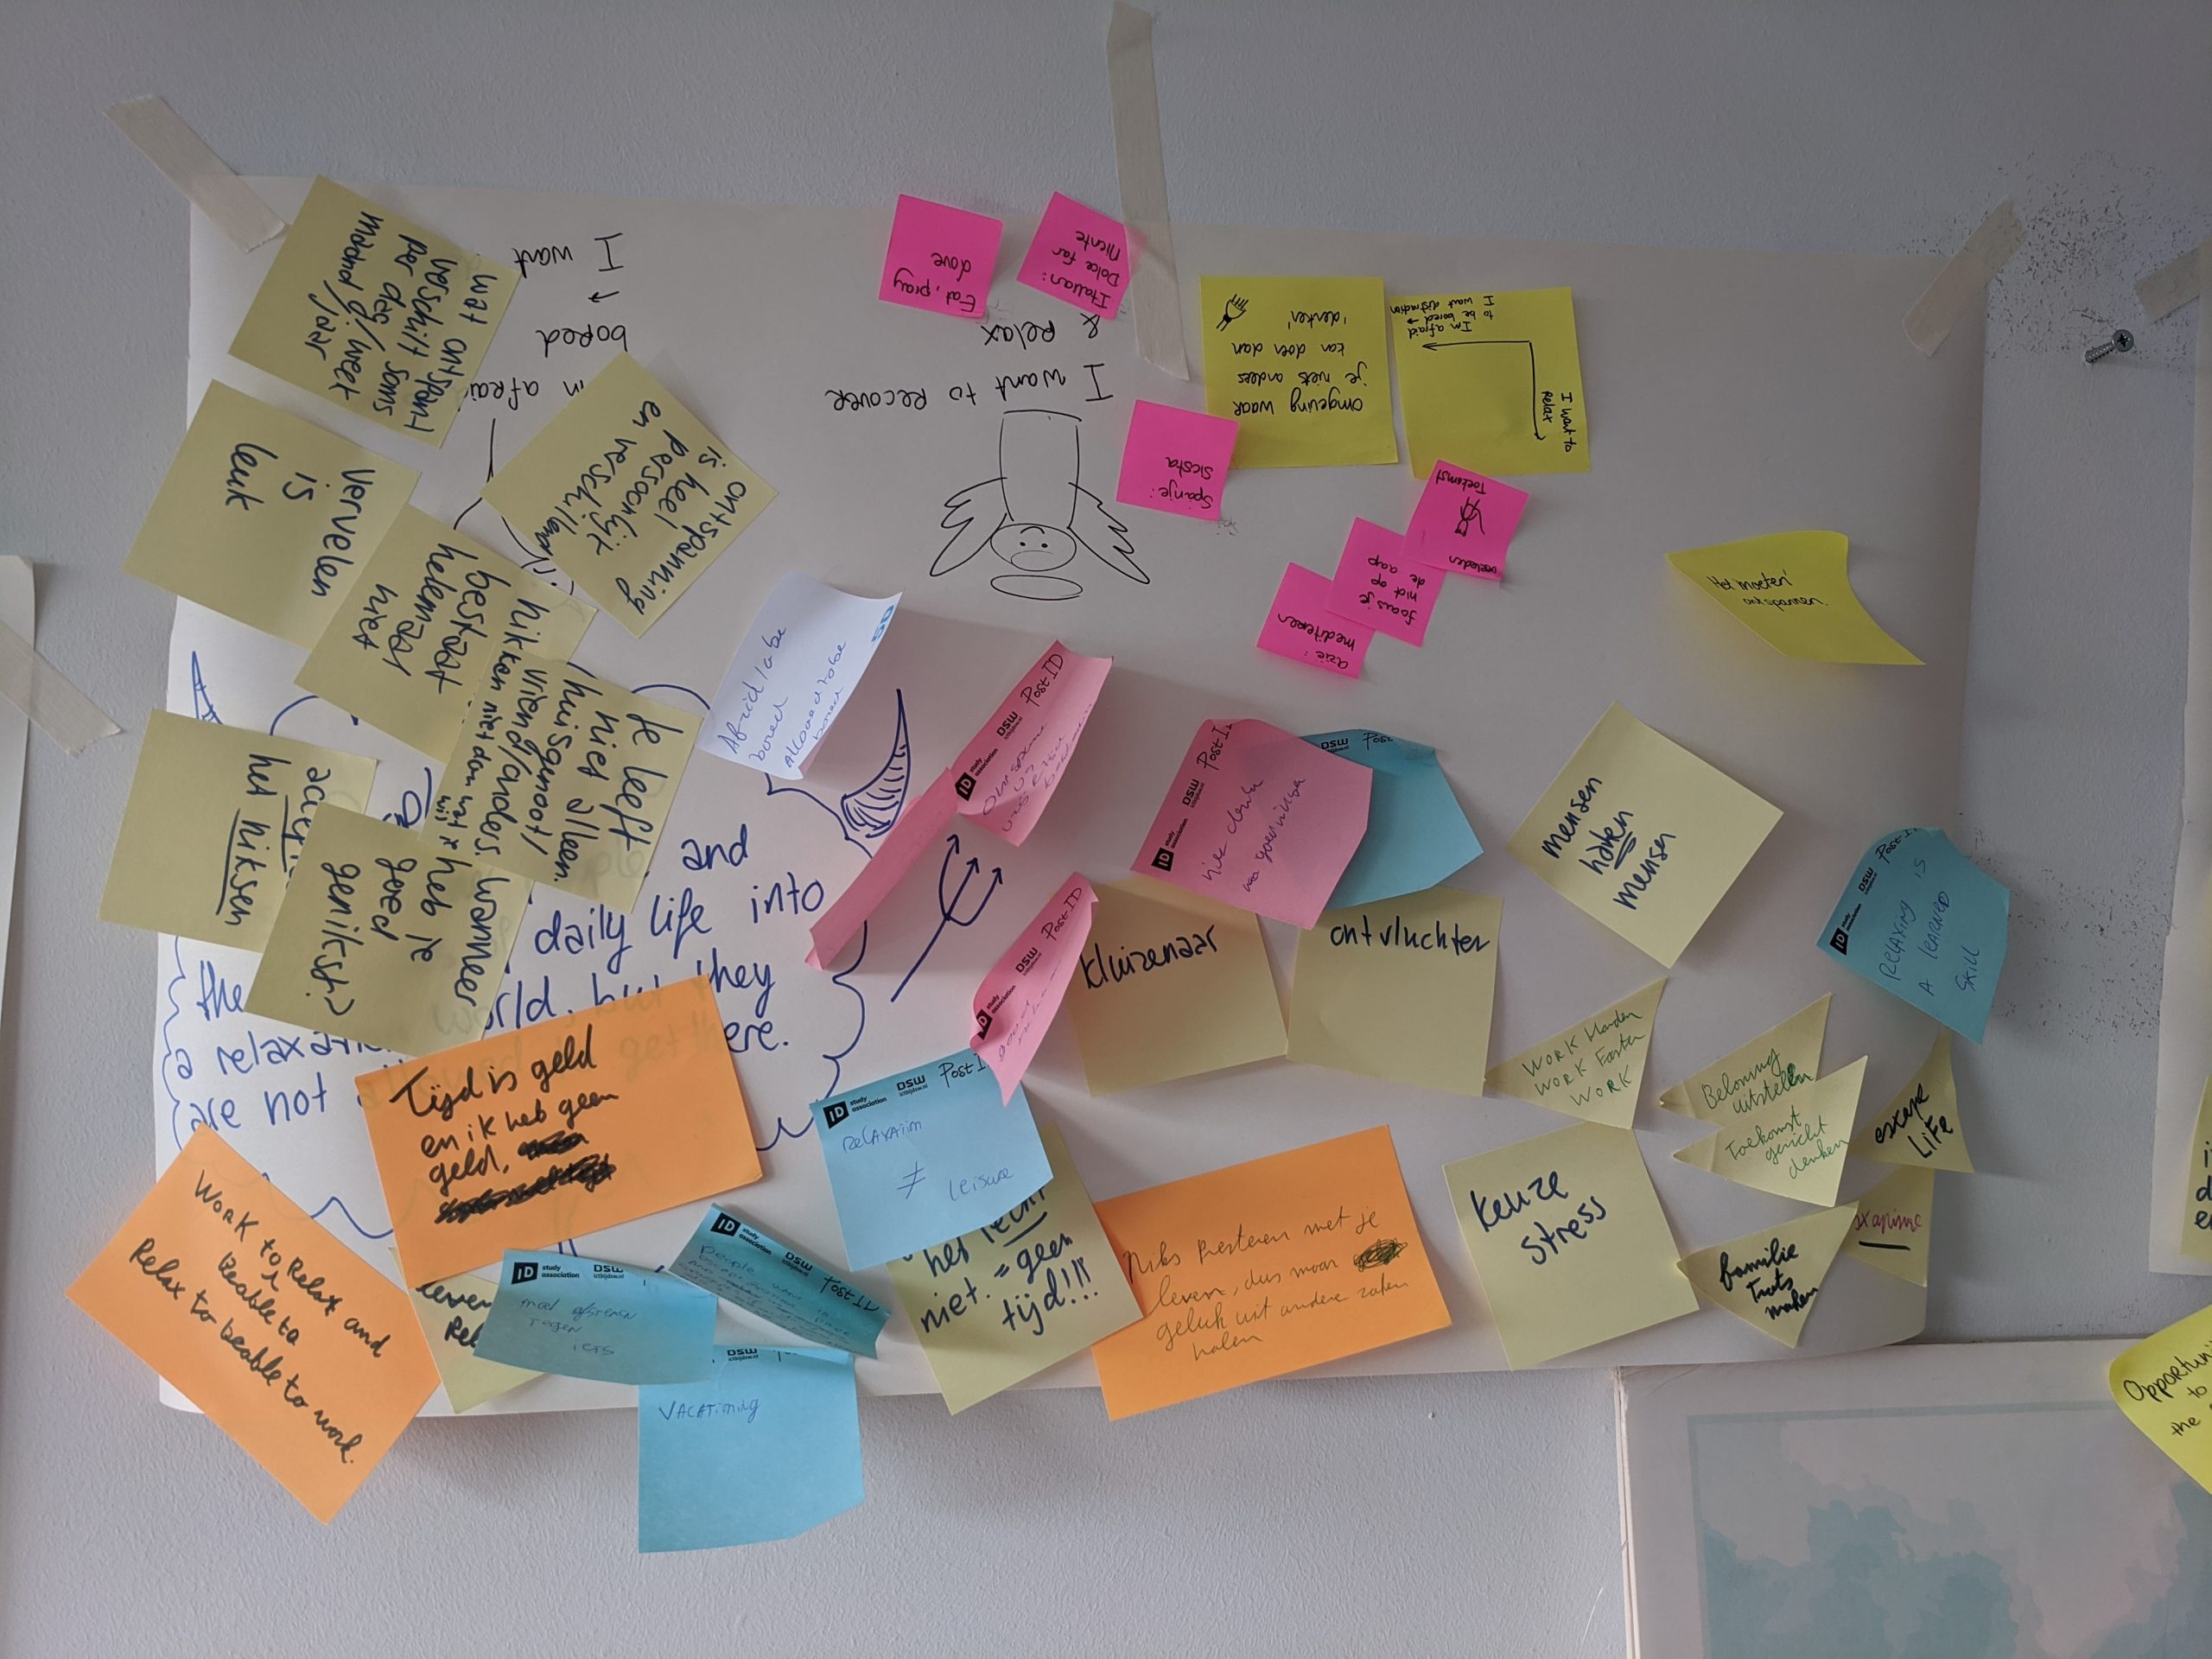
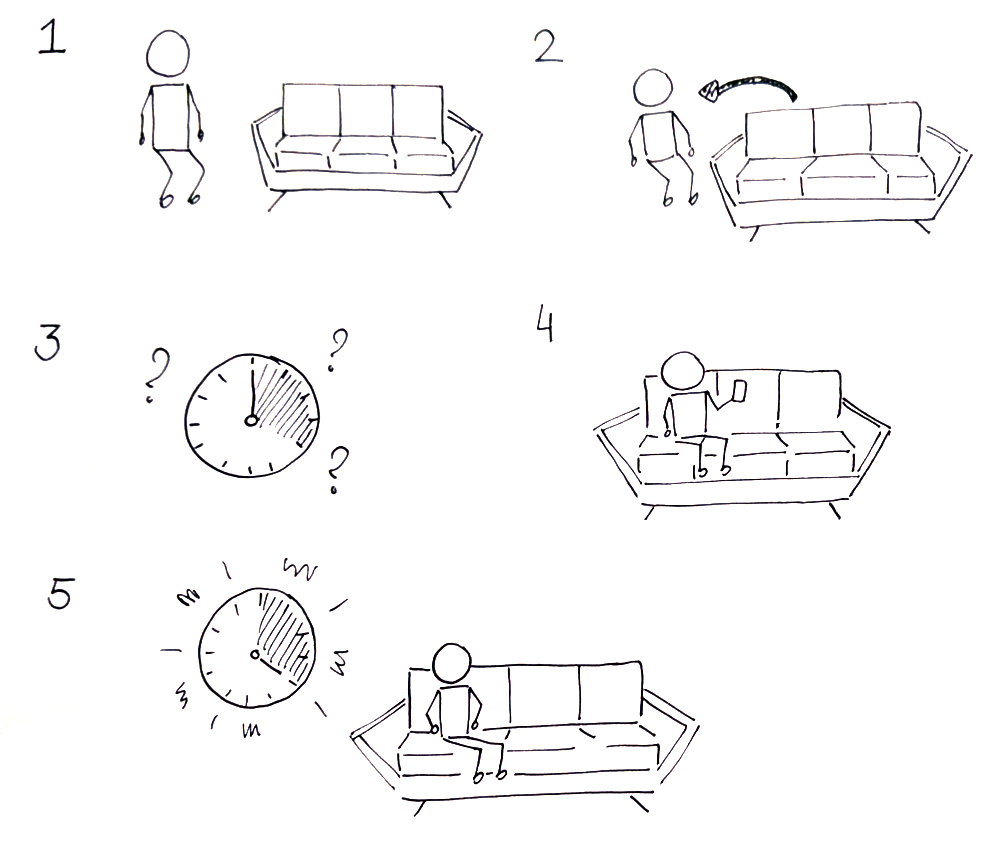
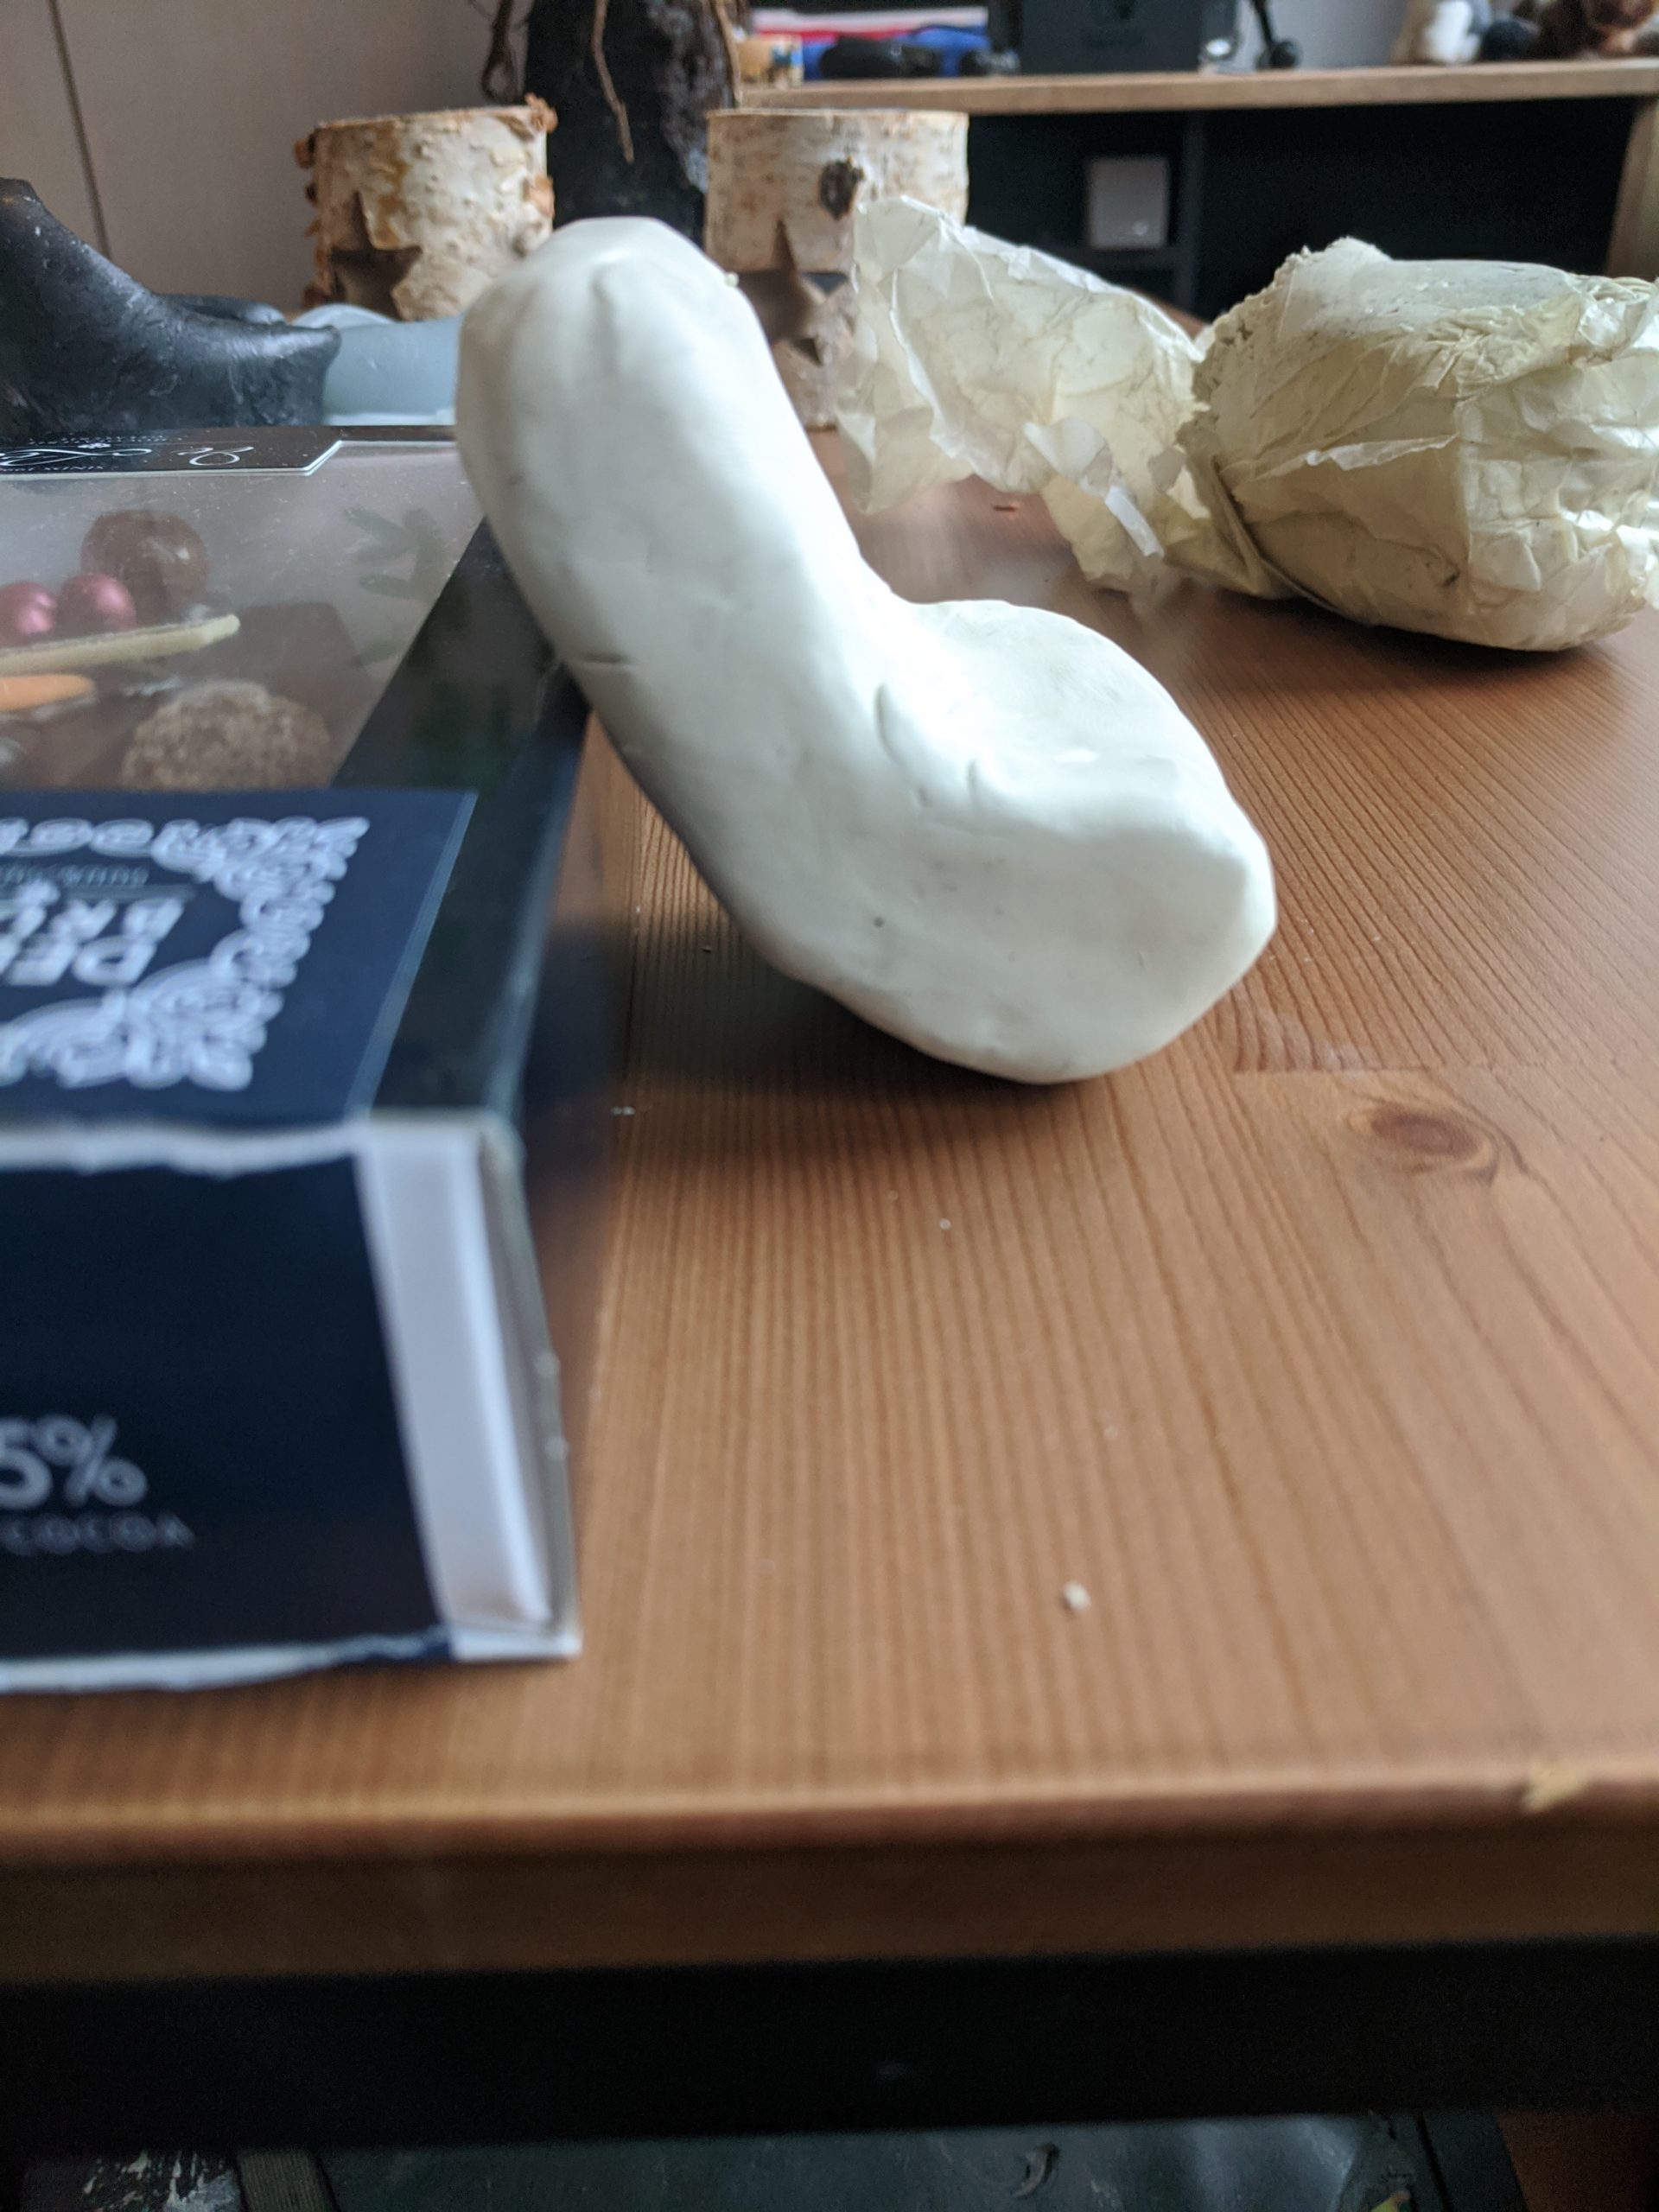
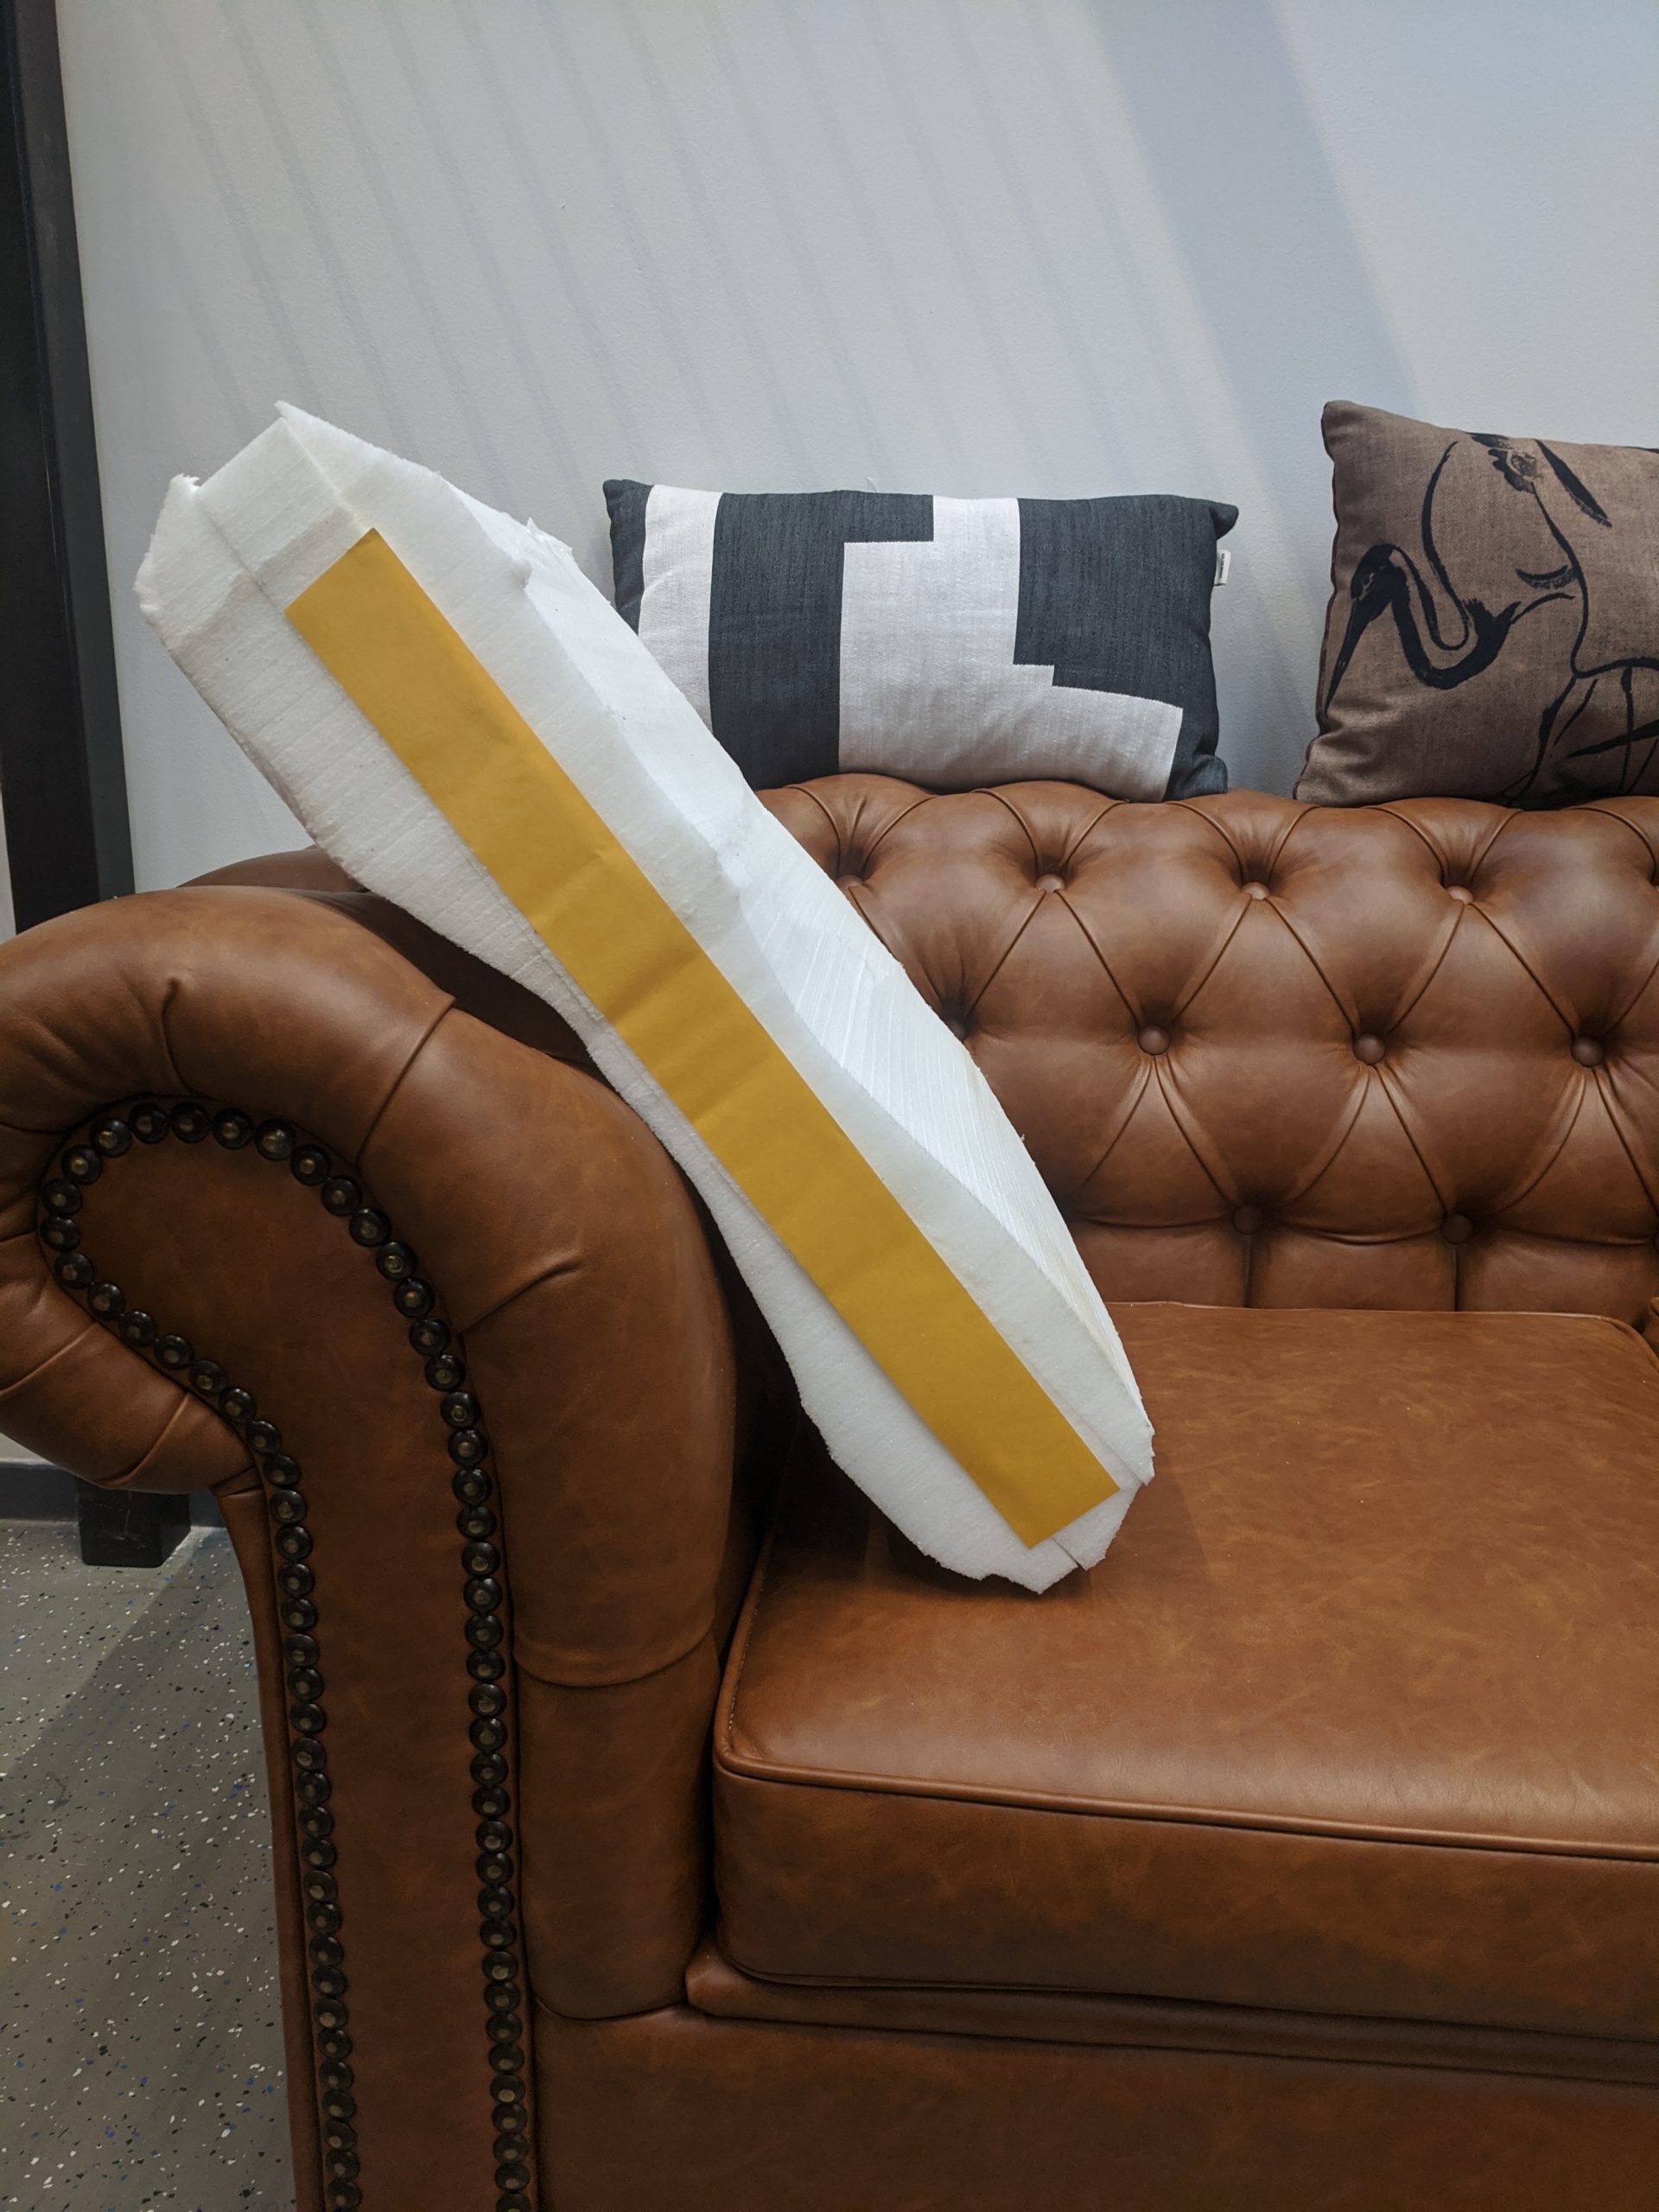
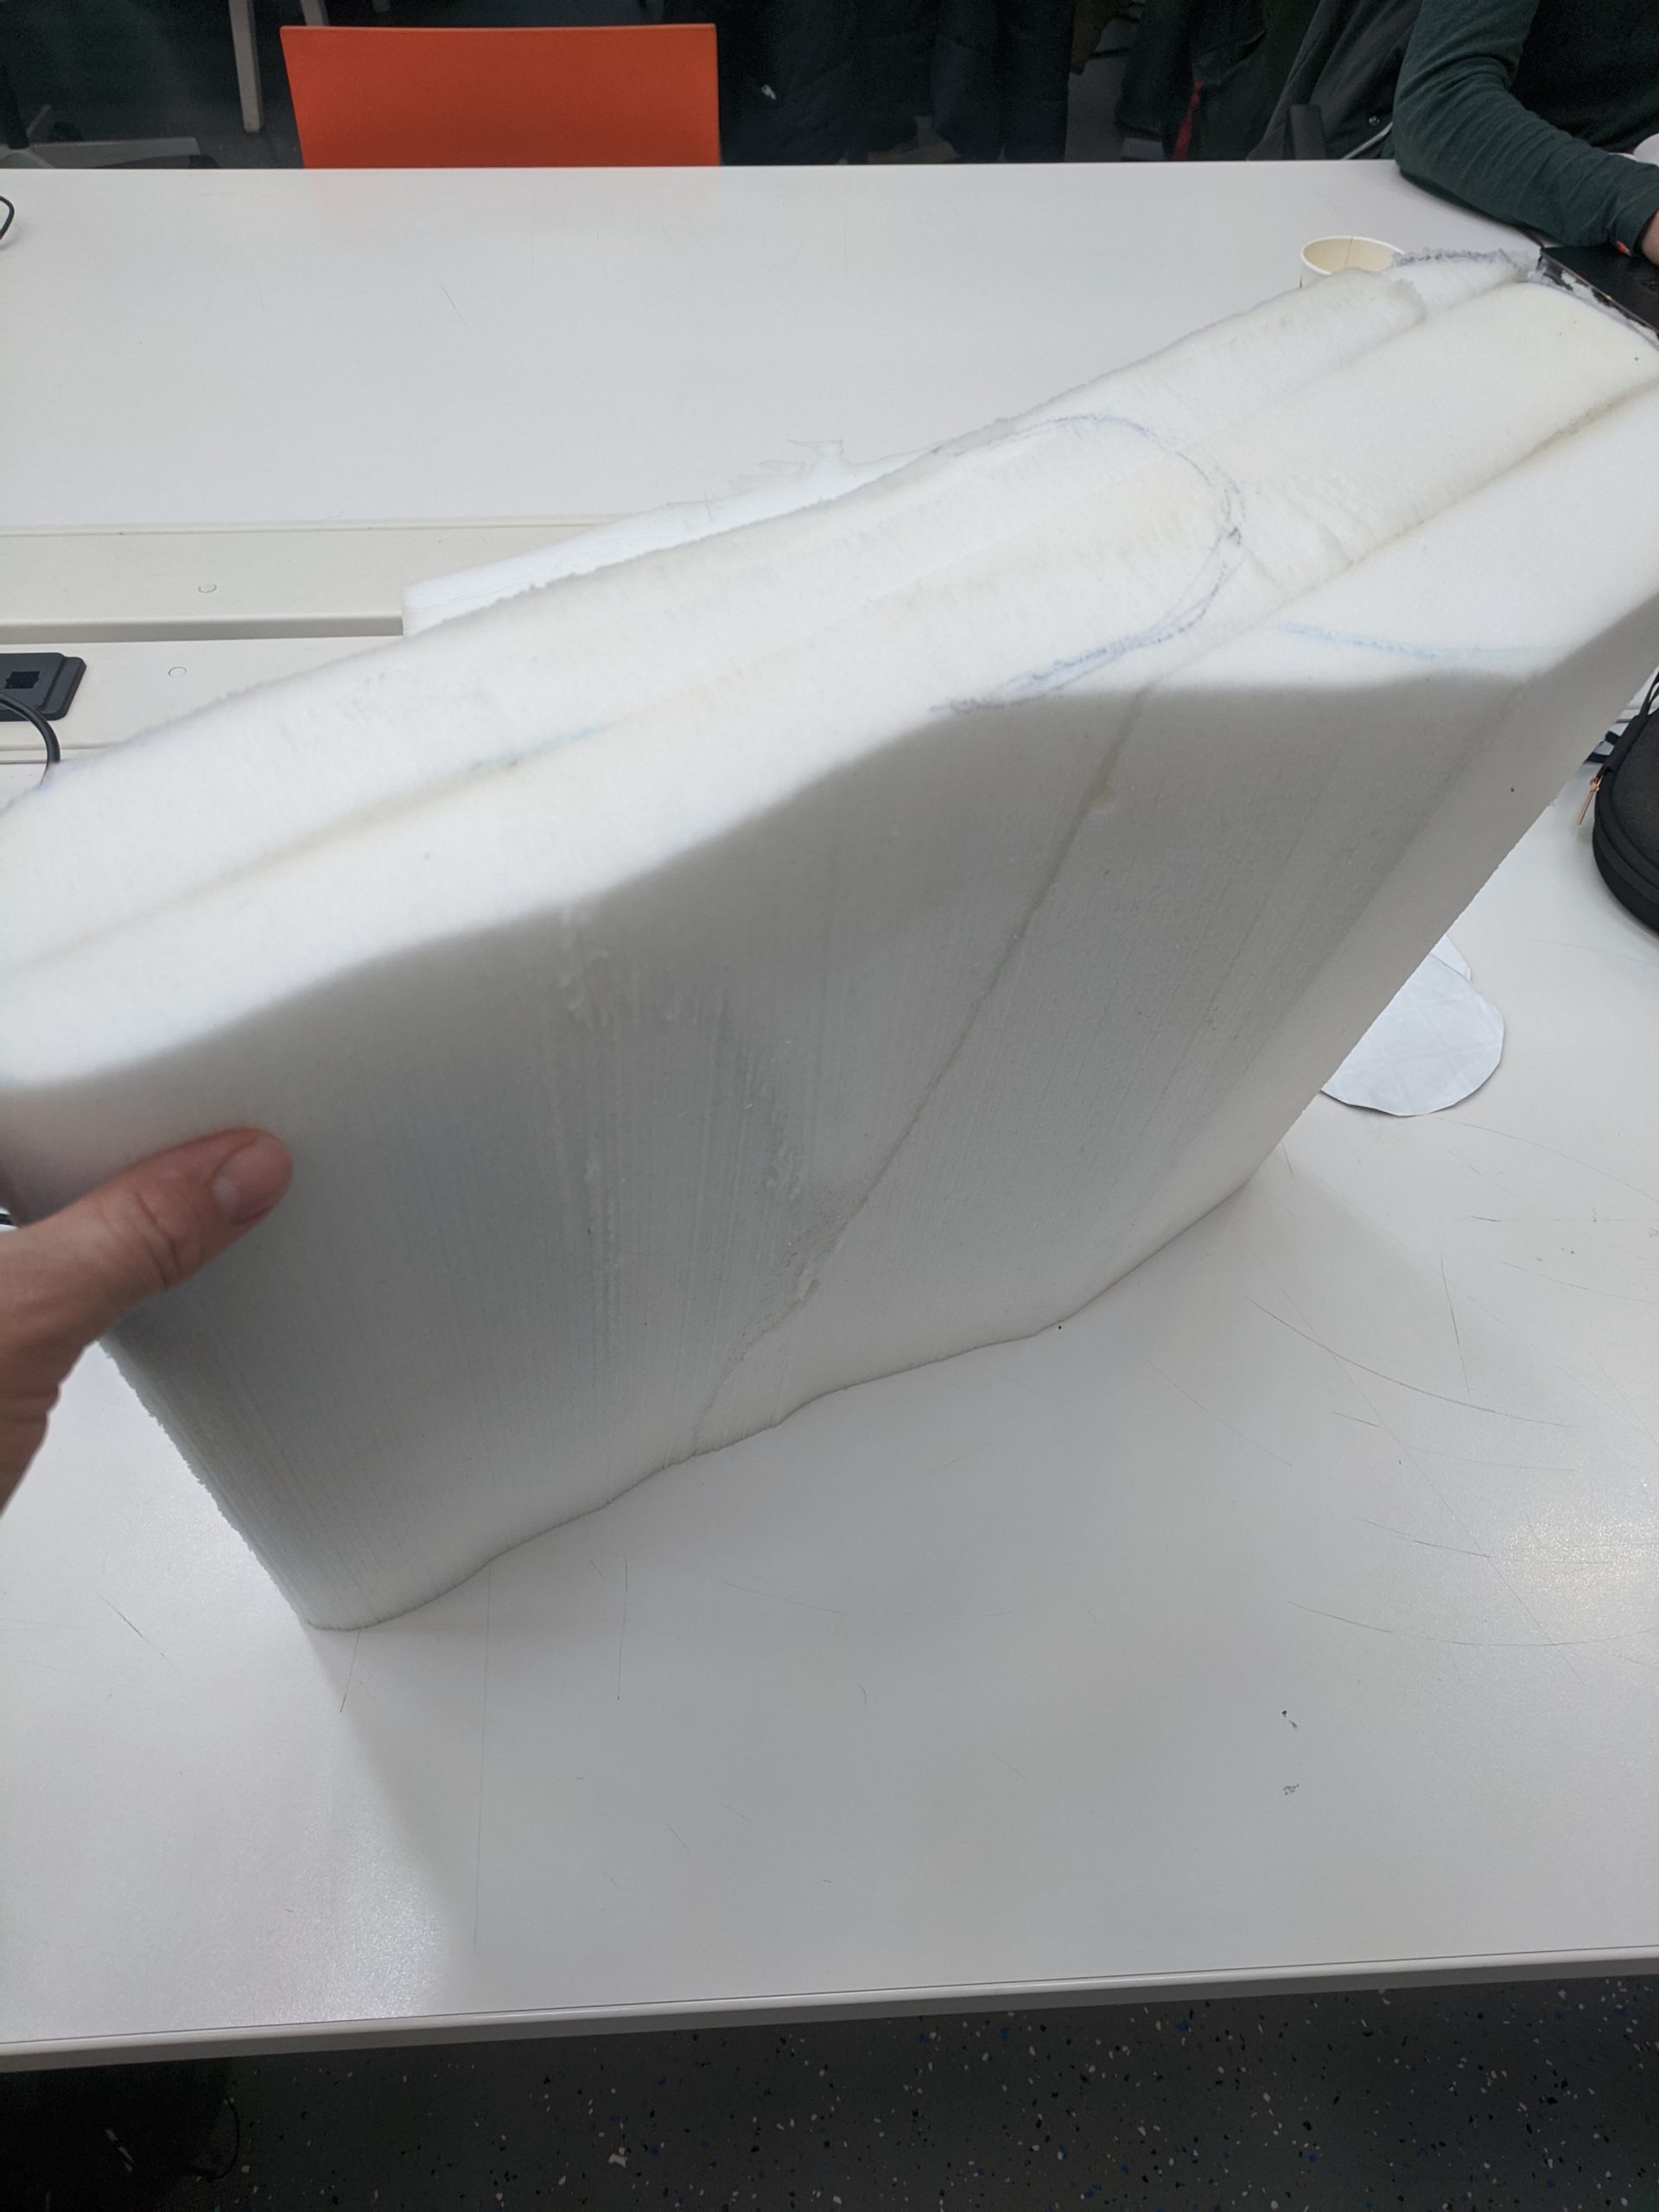
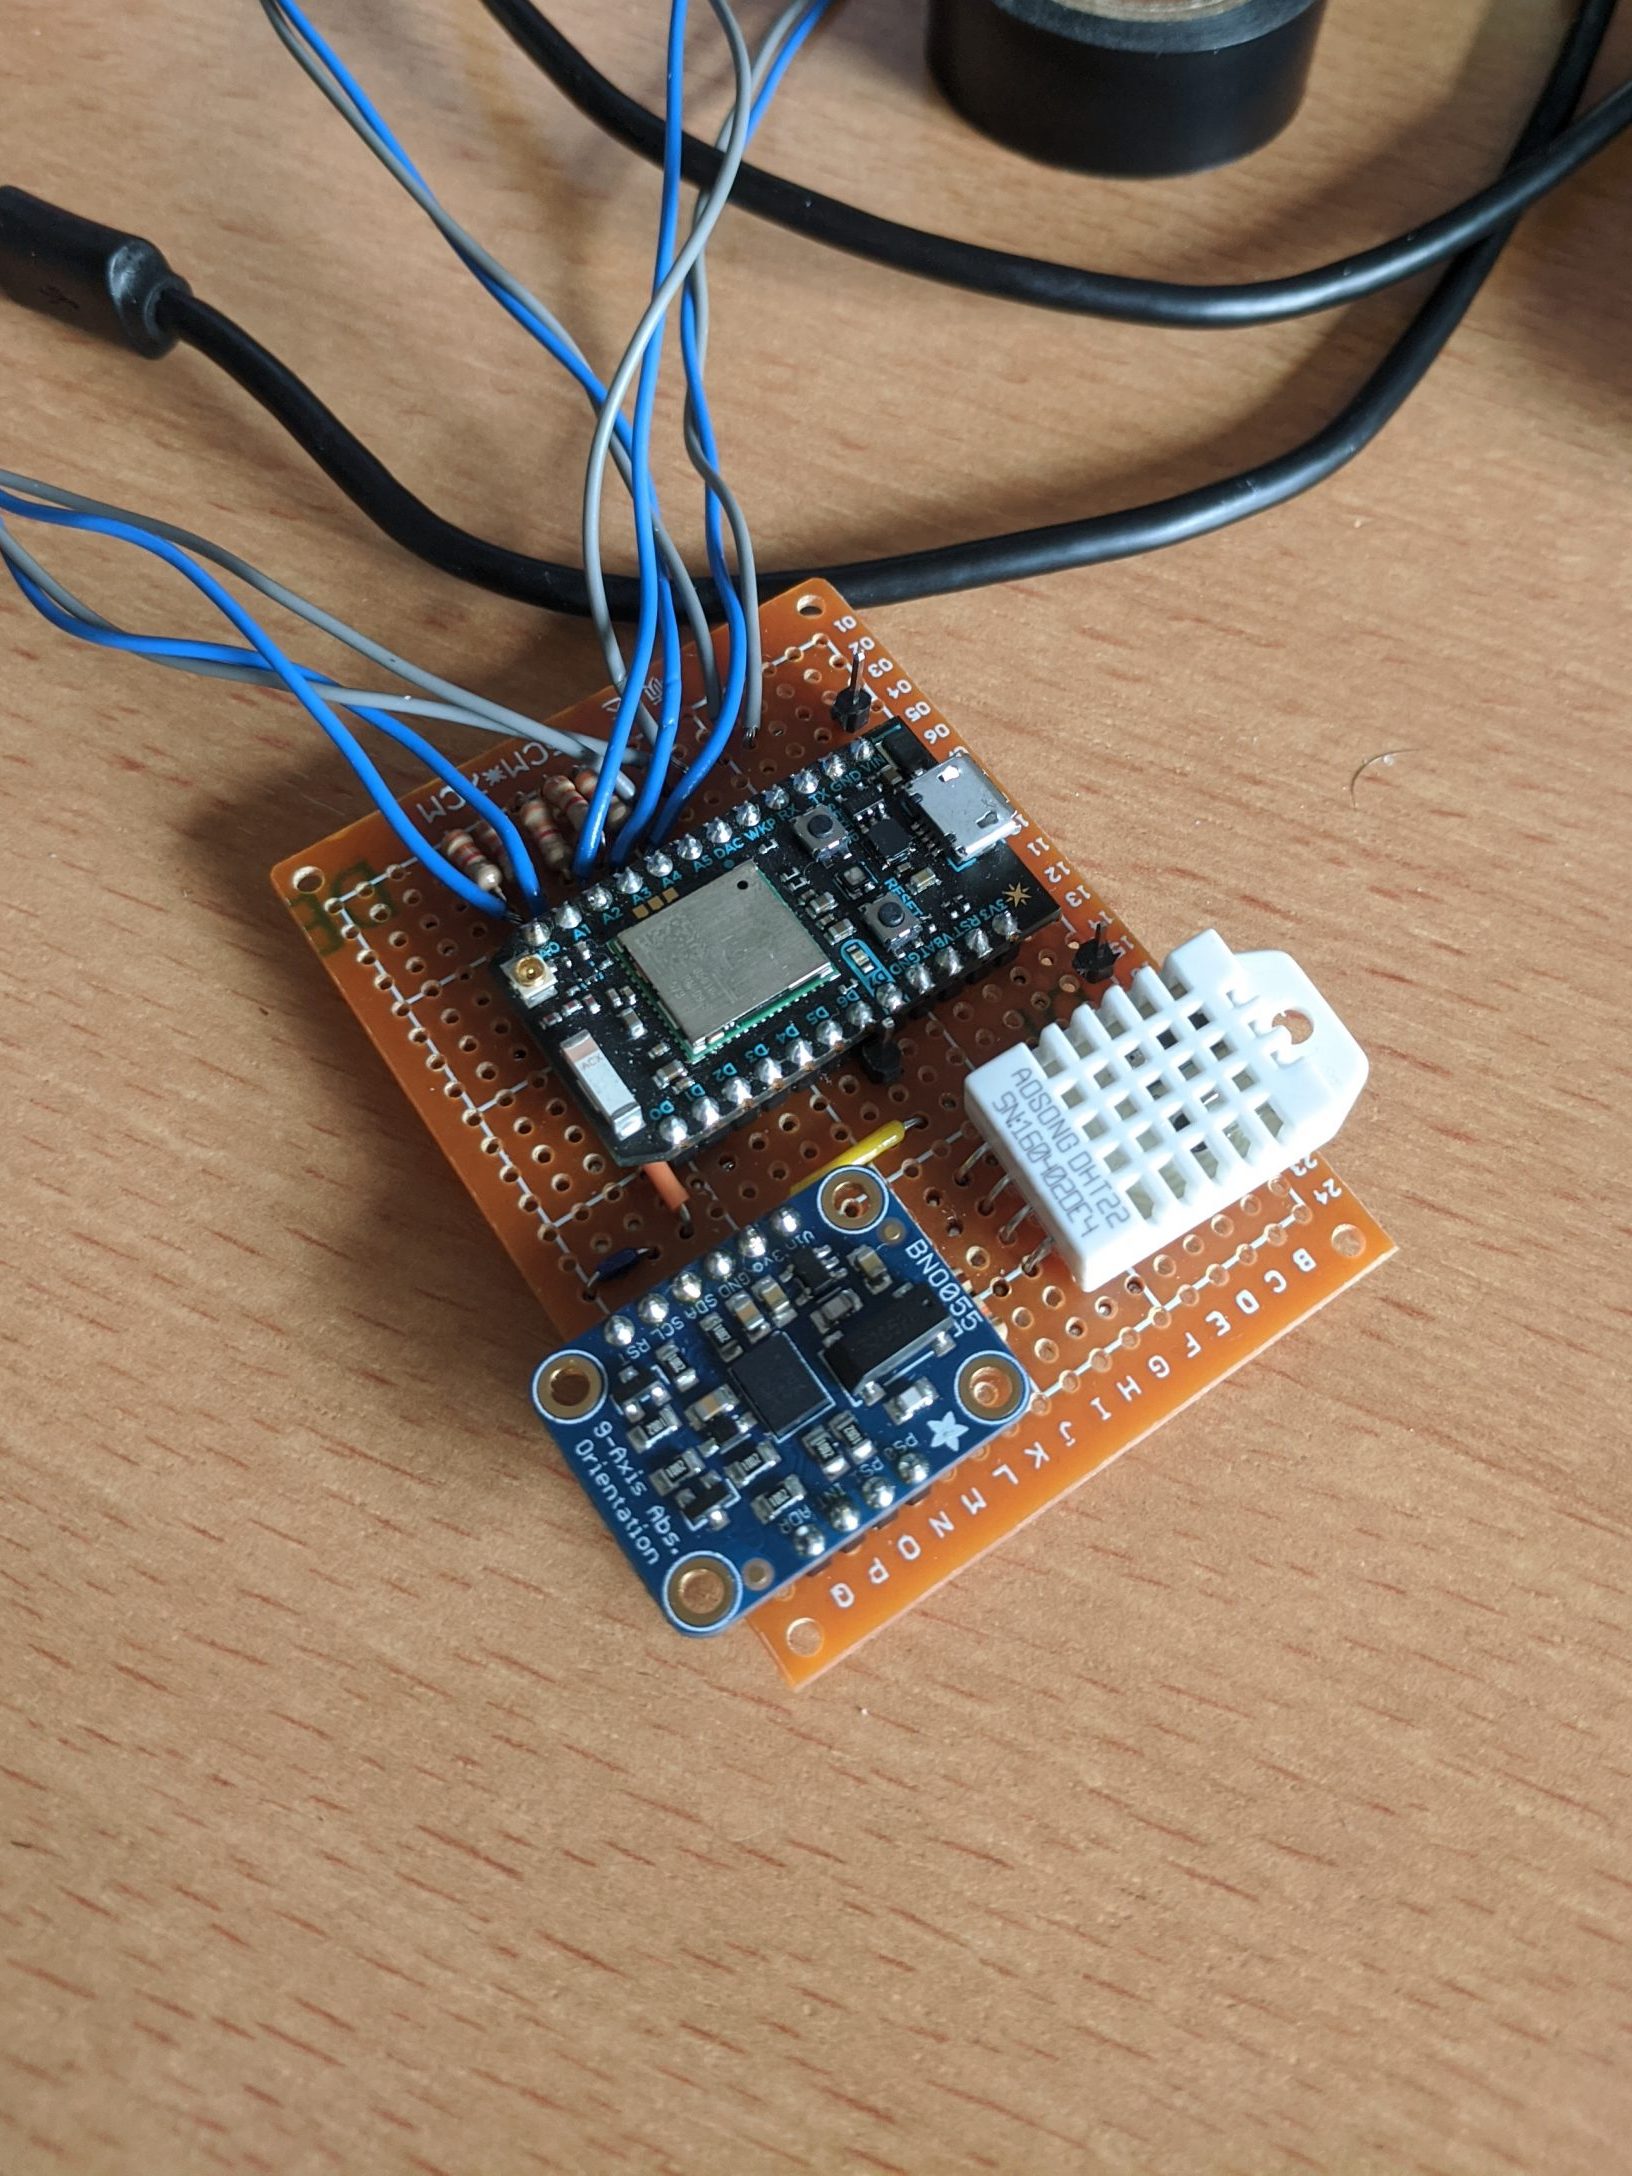
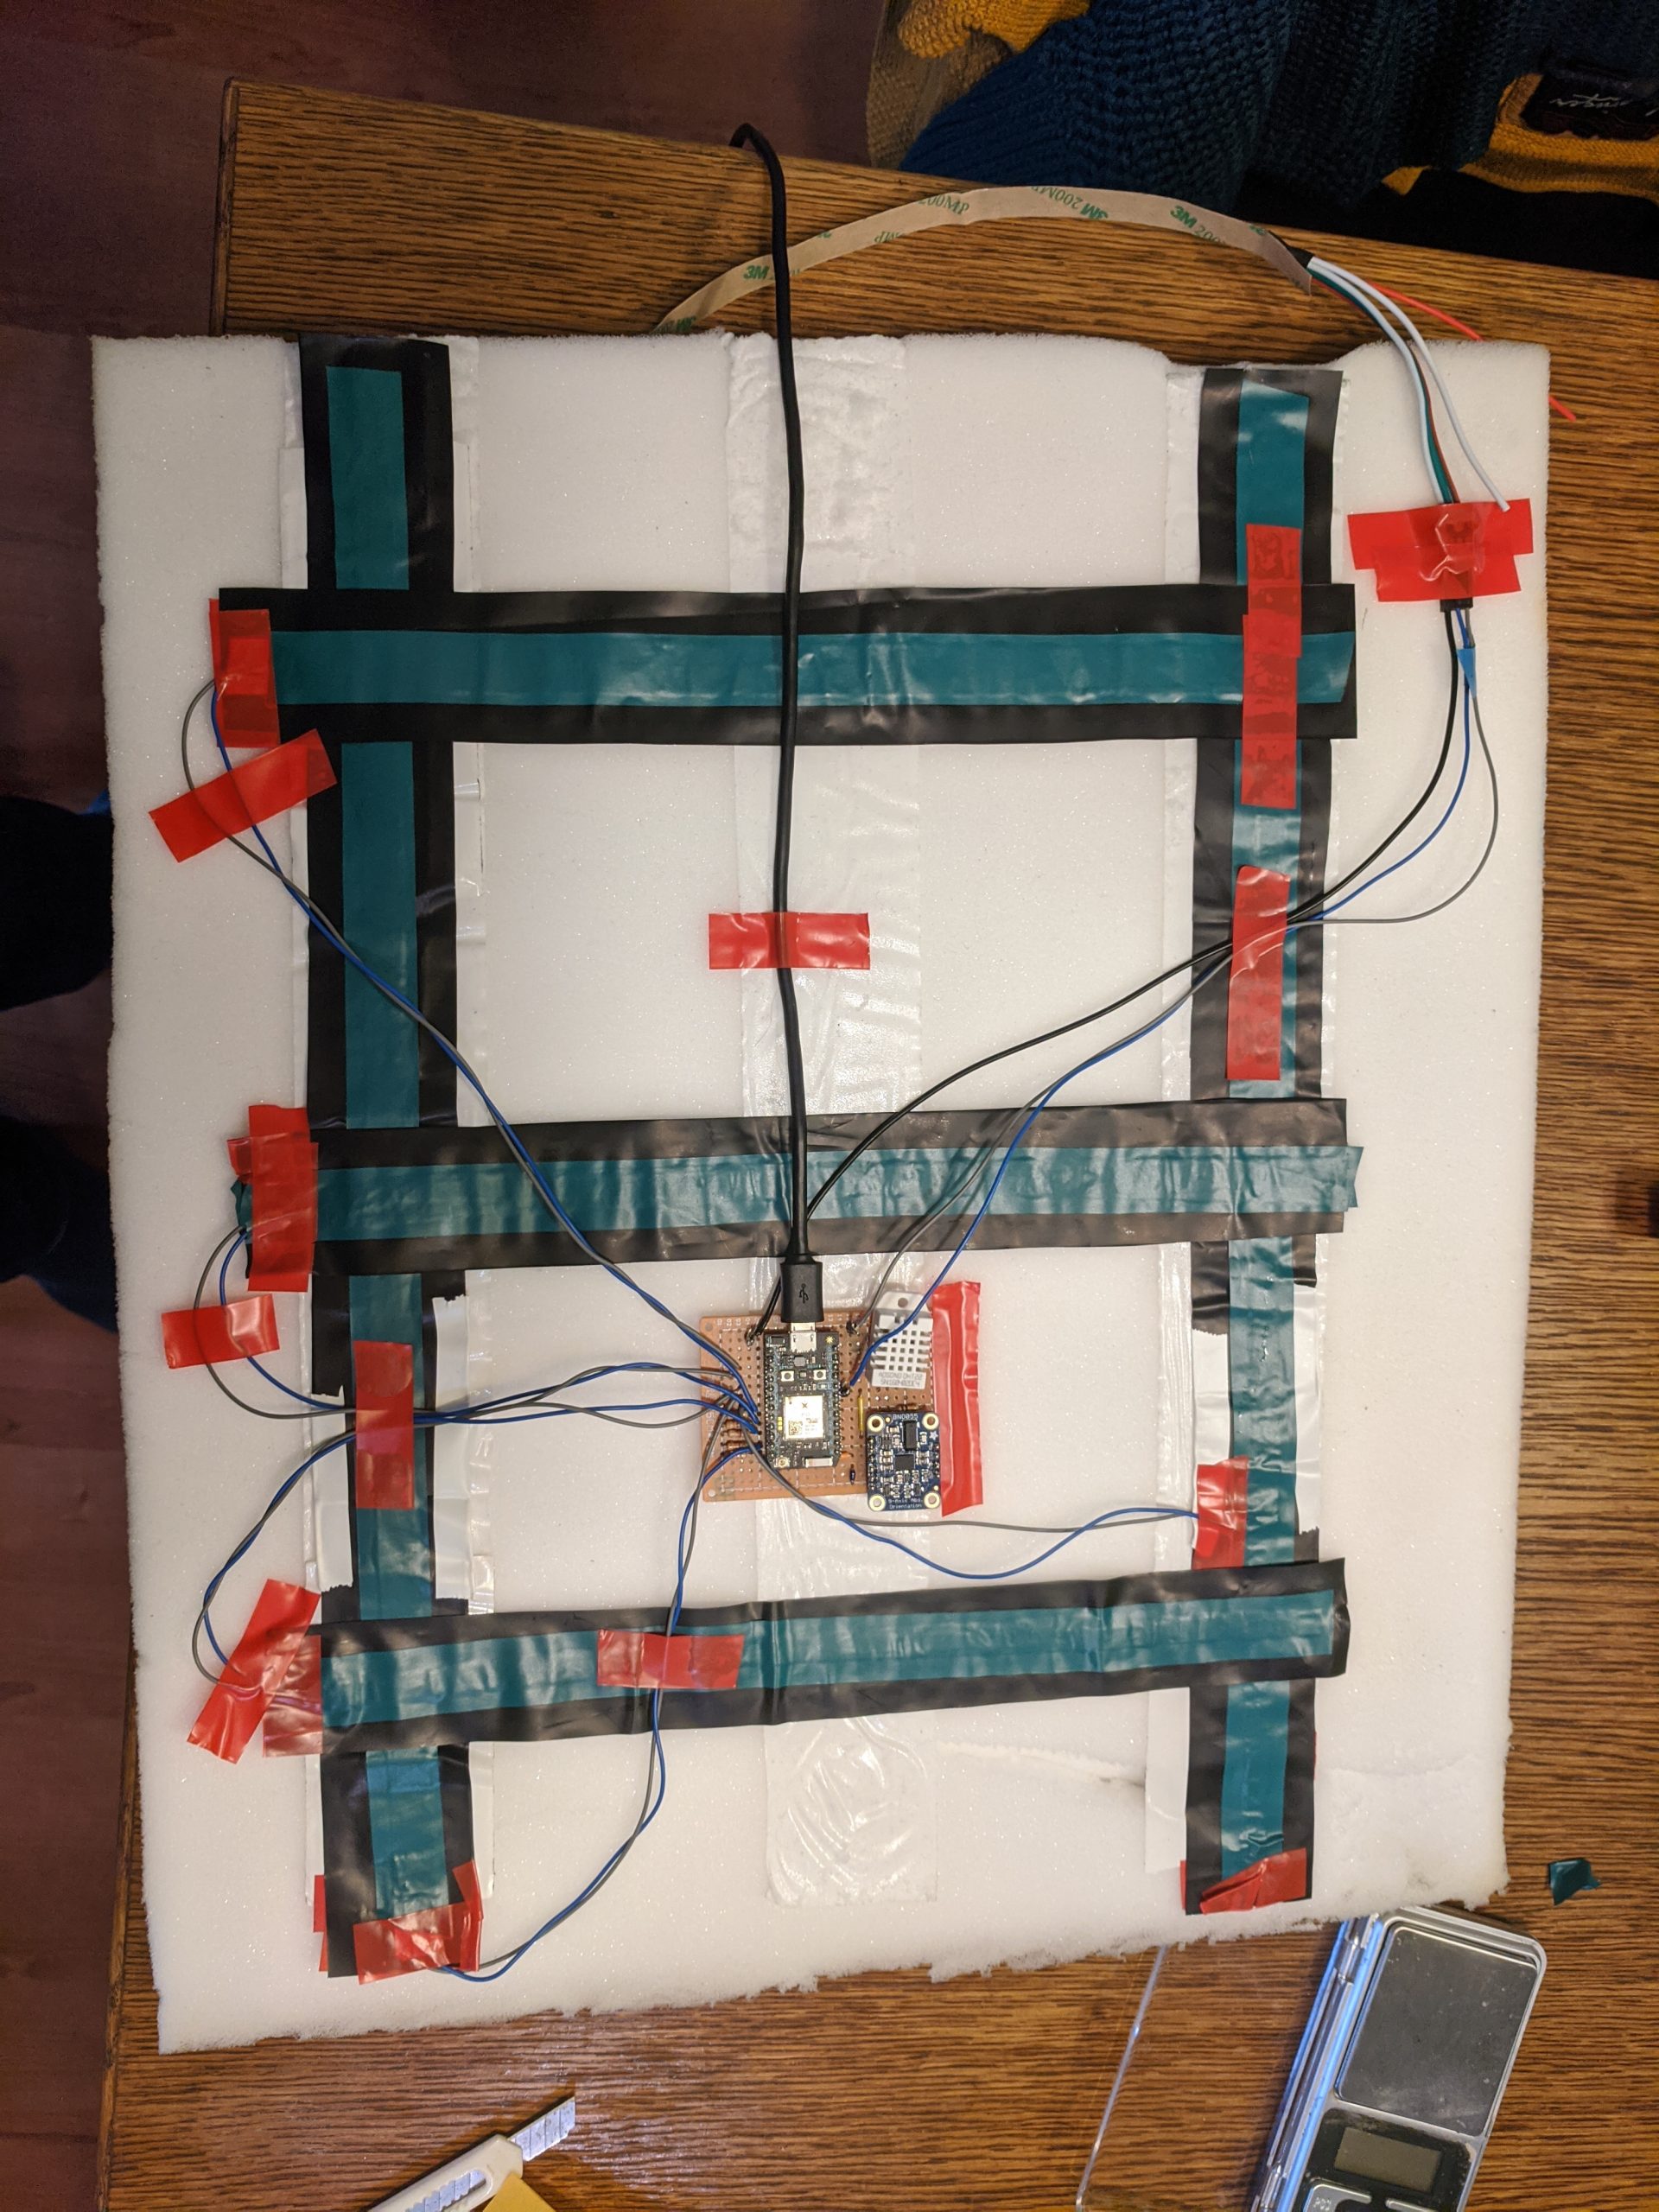
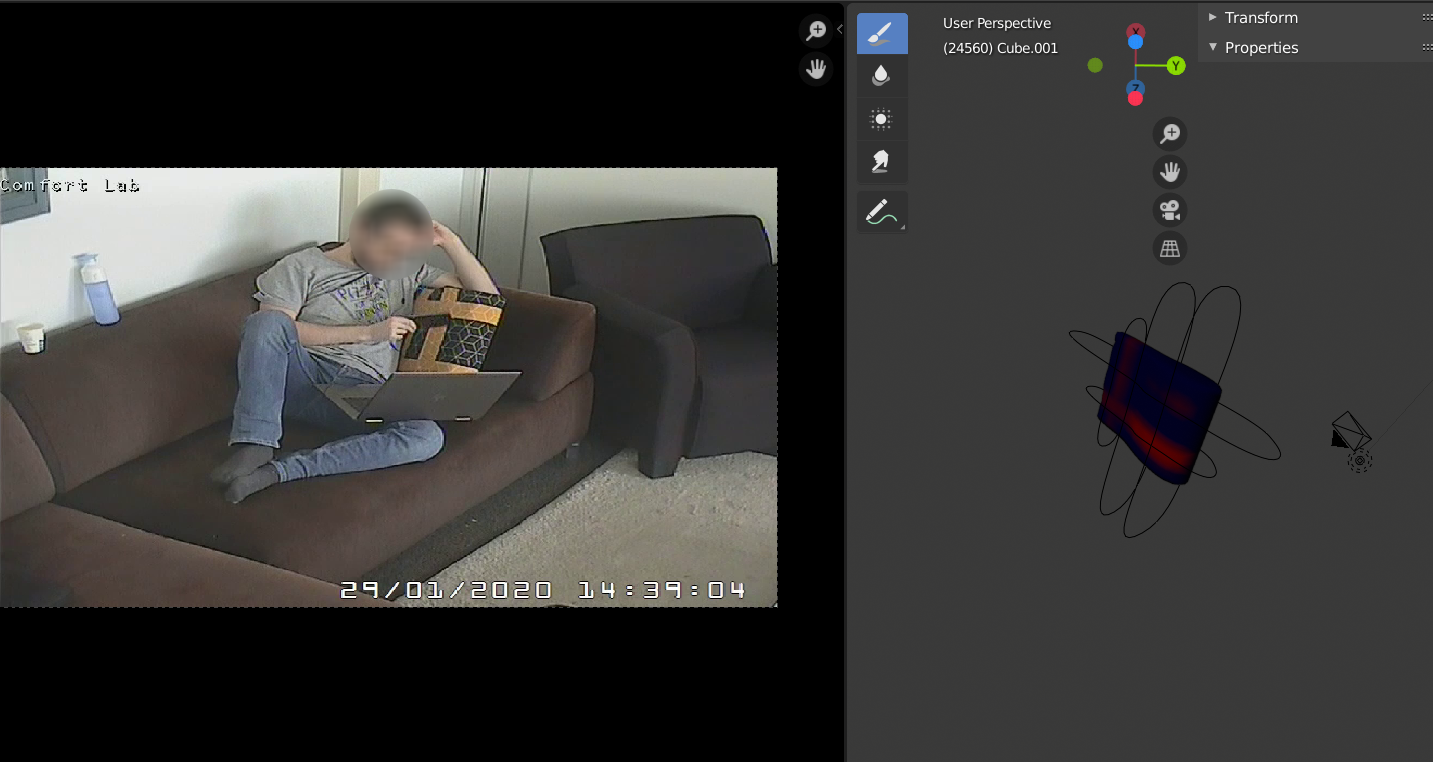
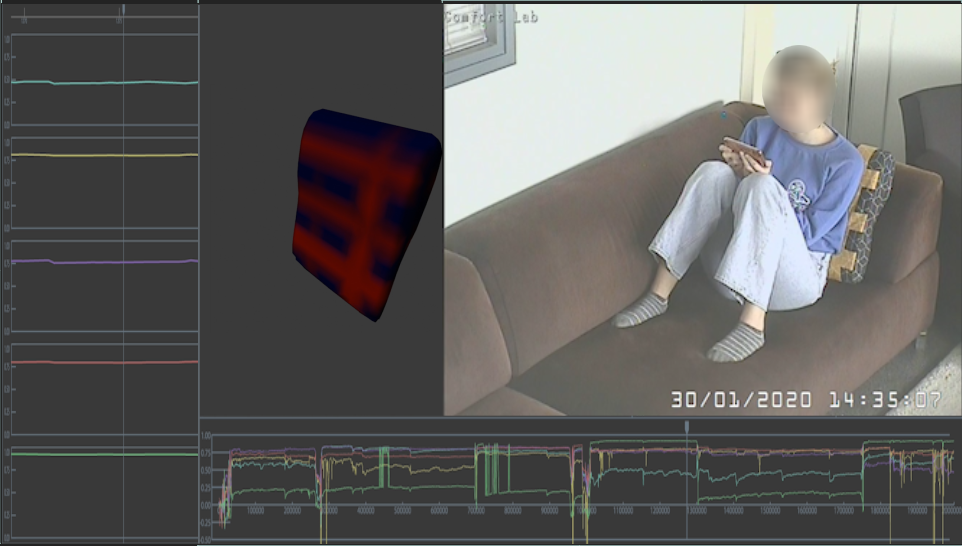
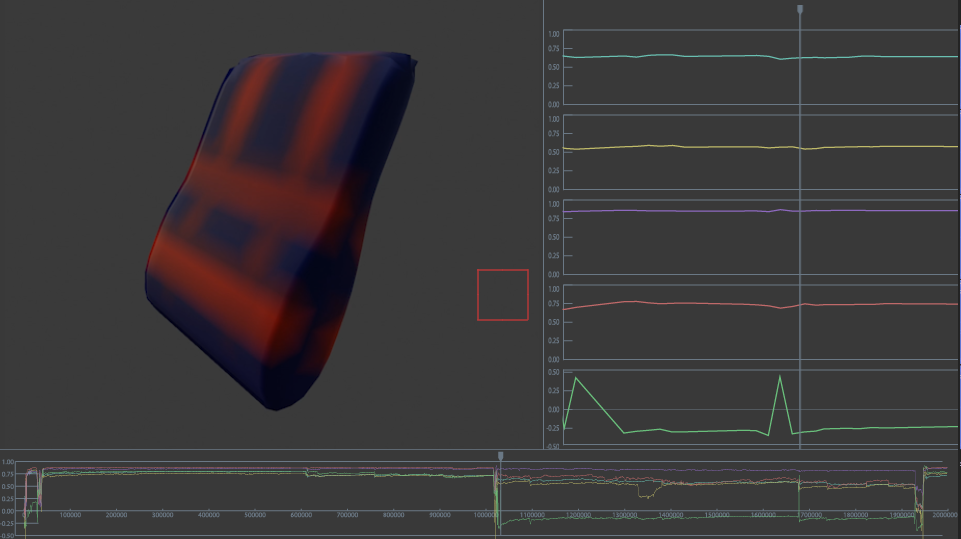
For my graduation, I did research on designing intelligent artefacts, their interactions and how data could be used in the process. This was done in the context of leisure in the living room. The result of this was a smart pillow that could actively provide comfort to users through hugging and by helping them to avoid slouching. The pillow prototype could sense the pressure applied on it, how it is positioned in space, and how warm it is. To get to this result traditional methods, such as user observations, interviews, tests, prototyping, desk research and co-creation, were used and sensor data was integrated into them. This was done by visualising the data and connecting it to the behaviour and experience of participants. The visualisation that proved most valuable in this is one were the pillow was recreated digitally and had the sensor data projected on it. This created something similar to a digital twin. By placing a video from the user next to it, the direct relationship between the usage and data could be seen. This allowed data to be used as a creative material and sparked a constant back and forth between data and usage. Based on this and other insights the interaction with the pillow was designed. 

Process

The goal of this project was to research on the design of intelligent artefacts, their interactions and how data could be used in the process. To do this I used leisure in the living room as a case study. The project consisted of four phases, context exploration, concept development, perspective and finally concept design. During each phase, I utilised three types of data, machine data, behavioural data and subjective data. Each provided a unique perspective and more insights were found at the intersections between data.

Types of data

Context Exploration

Couch equipped with sensors

During the first phase, the goal was to thoroughly understand how people relaxed in the context of a living room. To do so, a user test was set up where users were asked to relax inside a living room for an hour. During this time their behaviour was recorded and observed. Afterwards, they were interviews about their time and their daily lives with regards to relaxation. As an additional layer, pressure sensors were placed on the couch and covered with a blanket. This provided an additional perspective on their behaviour.

Afterwards, the data from the user test processed and analysed. For the interview, this meant transcribing the test and using ATLAS.ti to select and categorize quotes. Then these were analysed both inside of ATLAS.it and on paper. From here a model was created about their behaviour. The behavioural data was processed by labelling specific behaviours and visualising when they took place. The data from the sensors were placed on top of this to compare the two.

The results of these three types of data were compared to psychology research. Most noteworthy was the paper of Newman et al (2013), leisure and subjective well-being: a model of psychological mechanisms as mediating factors. To help me put the psychology research and my own research into perspective and formulate a clear design goal I organised a creative facilitated session. The session was let by a peer and was done in collaboration with students and users. Based on the performed research the following design goal was formulated.

Design Goal

I want to increase people’s subjective well-being during leisure after work by improving the quality of recovery-detachment and enforcing them to take control of how long they recover-detach.

Concept Development

As a first step in the second phase, a rough storyboard was created. This was done to translate the design goal into a situation and possible interaction. (1) The product should detect the presence of the person in the room or on the couch. (2) The product should then invite the person to use the product. (3) Based on the input of the user, a timer for how long the user wished to relax should be set. (4) The product should then support the relaxation of the user. (5) When the time is over the product should stimulate the person to leave the couch and stop recovering.

Based upon doing field research and the previous phase it was found that a pillow would be the most fitting product to transform into a smart object that can improve people’s time on the couch.  On the image below, the different stages of creating the shape and a prototype of a pillow are shown. The pillow is shaped to allow it to be used and comfortable in a wide variety of different postures. This was done because during the first user test it was found that people naturally and regularly switched there sitting positions. The pillow aims to provide comfort is as many of the postures found in the user test.

Final prototype
Electronics

Next to designing the shape of the pillow, the first part of its intelligence was also designed, its senses. The goal of these senses was for the pillow to be able to “see” how it’s being used. To do so, the temperature, the orientation and the pressure were being measured. The temperature and orientation sensors were bought and the pressure sensors were made. They were placed inside the pillow and together they were able to collect data about its usage and sent this data to a server.

Perspective Discovery

The goal of the thirds phase was to understand the perspective of the user and of the product. To get this understanding, that data-enabled prototype was used during a user test. This test consisted of three parts, usage of the pillow, interview about the usage and co-creation about the further development of the pillow. The data from this test was then processed into visuals to enable analysis. To do so, the machined data was first put into excel and get an initial image of what the data looked like.

Pressure sensor data in excel

The Excel graph, however, did not provide many insights. Therefore I looked for a better, more inspiring way to visualise the sensors data. I landed on creating digital twin that represented the pillow in real life. To create this digital representation blender was used. First, the model was created, afterwards, the data from the server was used as input for an animation.

Creating a 3d model in blender

This animation was then put next to a video of the observation to link the two together. Some interesting behaviours were compiled into a video. This video was then used to analyse the data gathered from the user test which was then used as an input for further designing the product.

Concept Design

Final design drawing

During the fourth phase, the concept of the pillow was further designed. During this procces the visualisation from the previous phase was used continously. First the shape of the pillow was redesigned. The inner, ergonomic, shape was kept but the outer shape was changed to look more like a throw pillow.

Secondly, the pillow was given actuators to allow it interact with the world around it. The first actuator that was added was a conductive fabric. This fabric heats up as a current is applied to it. This allows the pillow to provide the user with extra warmth. Secondly air pockets are added to the pillow. This allows the pillow to encapsulate and hug the user. It also provides the pillow with way to communcate with the user. For instance by activating all air pockets for a short burst the pillow creates discomfort for the user letting the user know their time is up

With the addition of actuators, the interaction with the pillow was further developed. This was done by creating a storyboard. Each drawing in the storyboard consists of 3 parts, the top part shows the situation. In the bottom left part the pillow is displayed, blue shows pressure applied by the user, grey shows air pockets that are activated by the pillow. In the bottom right two graphs can be seen, the top shows the pressure applied by the user over time, the bottom the actuation of the air pockets over time by the pillow.

More Info

For more info, you can view my complete graduation presentation, or read my graduation thesis. If you have any additional questions, feel free to contact me.