Graduation Project
The making of a smart pillow
Designing an object with intent through a data-enabled design process
Project details
Project type:
ECT:
Time:
Client:
Nature:
Grade:
Links:
Keywords:
Master Graduation
30
2019/2020
TU Delft
Individual Project
9.0
Tudelft repository, Dutch Design week
Co-Creation, Data visualisation, Desk research, Interviews, Product design, Programming, Prototyping, User observations & UX
Project type:
ECT:
Time:
Client:
Nature:
Grade:
Links:
Keywords:
Master Graduation
30
2019/2020
TU Delft
Individual Project
9.0
Tudelft repository, Dutch Design week
Co-Creation, Data visualisation, Desk research, Interviews, Product design, Programming, Prototyping, User observations & UX
Summary
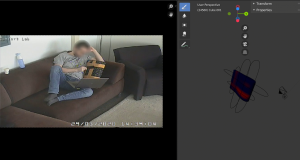
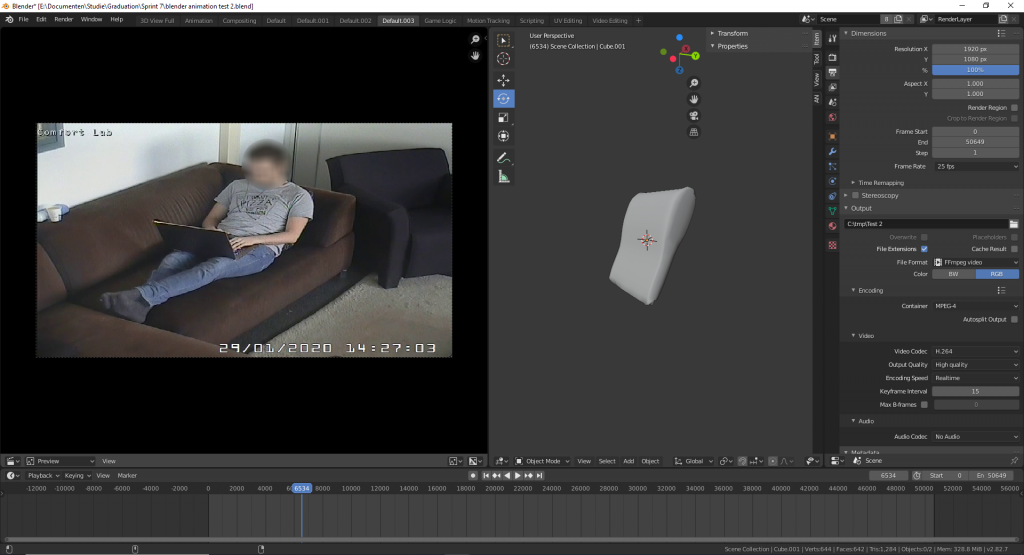
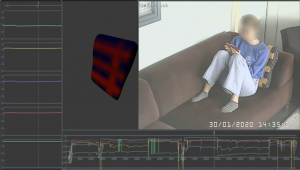
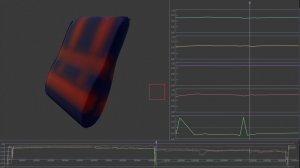
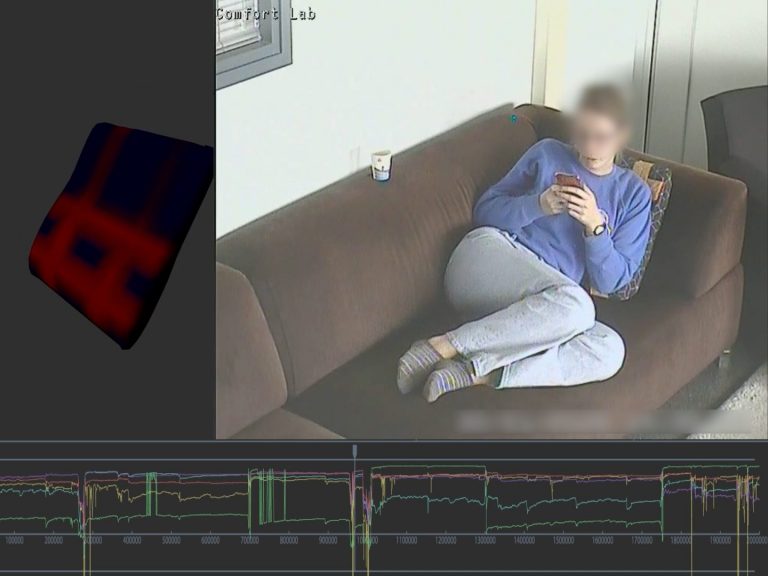
For my graduation, I did research on designing intelligent artefacts, their interactions and how data could be used in the process. This was done in the context of leisure in the living room. The result of this was a smart pillow that could actively provide comfort to users through hugging and by helping them to avoid slouching. The pillow prototype could sense the pressure applied on it, how it is positioned in space, and how warm it is. To get to this result traditional methods, such as user observations, interviews, tests, prototyping, desk research and co-creation, were used and sensor data was integrated into them. This was done by visualising the data and connecting it to the behaviour and experience of participants. The visualisation that proved most valuable in this is one were the pillow was recreated digitally and had the sensor data projected on it. This created something similar to a digital twin. By placing a video from the user next to it, the direct relationship between the usage and data could be seen. This allowed data to be used as a creative material and sparked a constant back and forth between data and usage. Based on this and other insights the interaction with the pillow was designed.
Process
The goal of this project was to research on the design of intelligent artefacts, their interactions and how data could be used in the process. To do this I used leisure in the living room as a case study. The project consisted of four phases, context exploration, concept development, perspective and finally concept design. During each phase, I utilised three types of data, machine data, behavioural data and subjective data. Each provided a unique perspective and more insights were found at the intersections between data.
Context Exploration
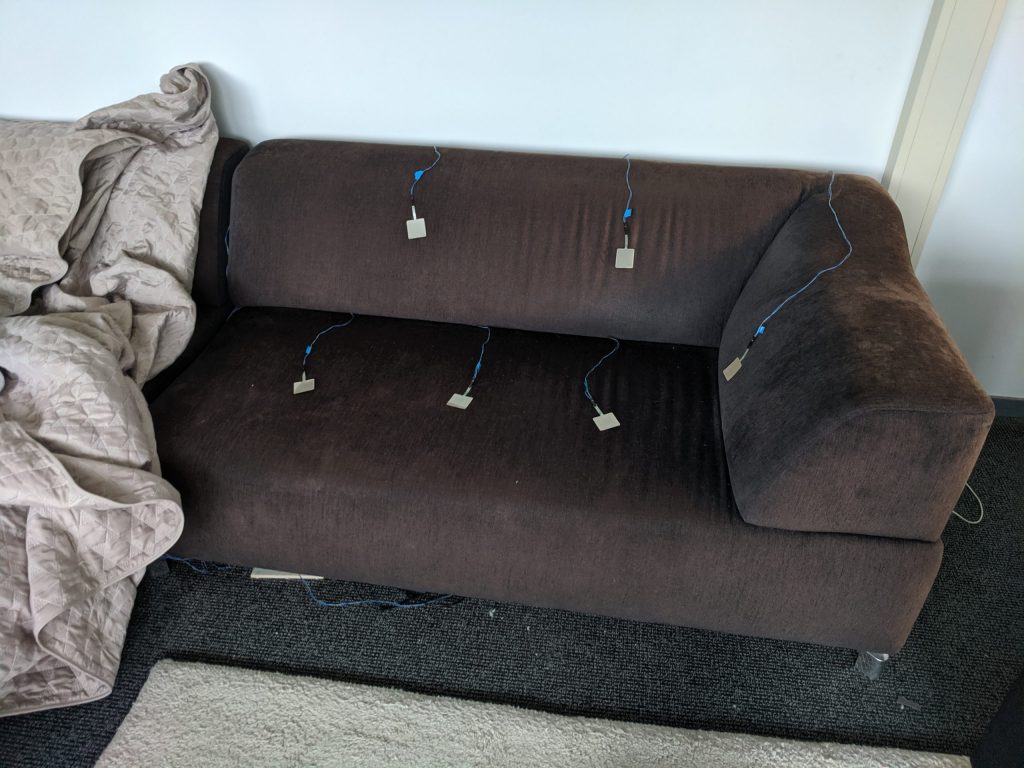
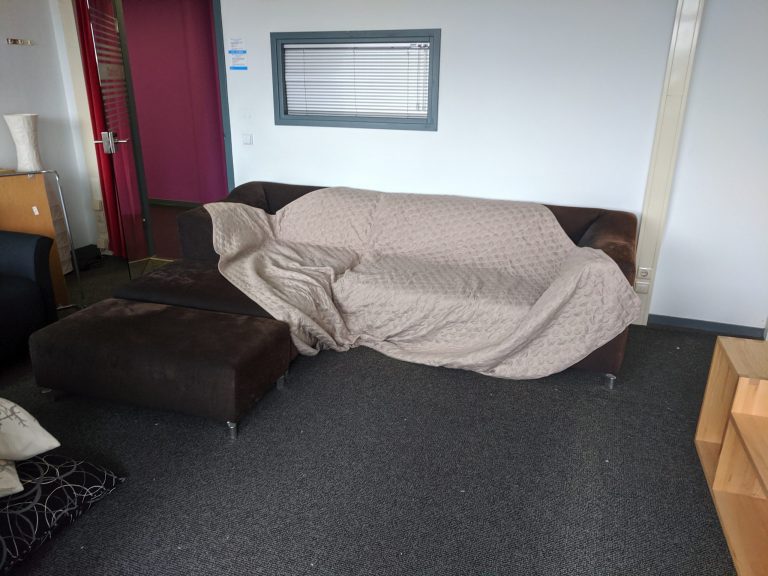
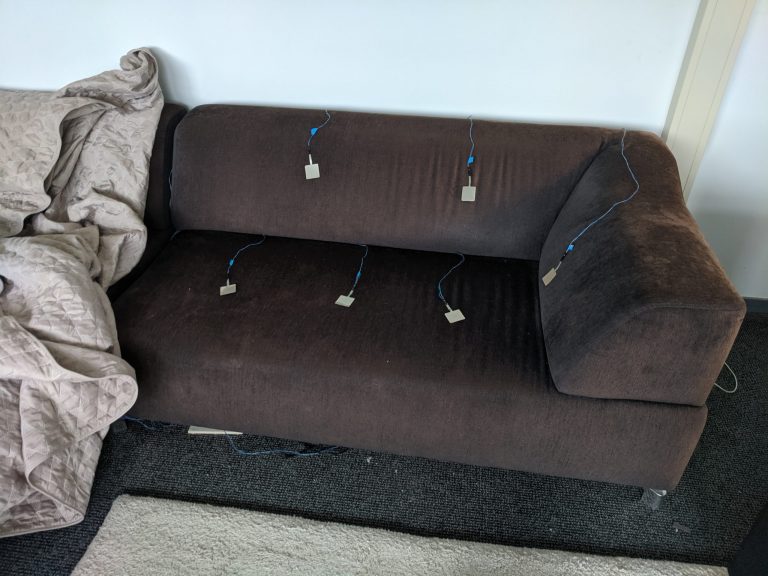
During the first phase, the goal was to thoroughly understand how people relaxed in the context of a living room. To do so, a user test was set up where users were asked to relax inside a living room for an hour. During this time their behaviour was recorded and observed. Afterwards, they were interviews about their time and their daily lives with regards to relaxation. As an additional layer, pressure sensors were placed on the couch and covered with a blanket. This provided an additional perspective on their behaviour.
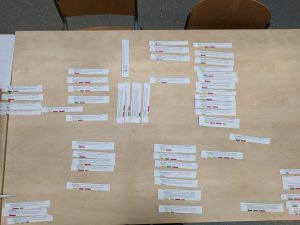
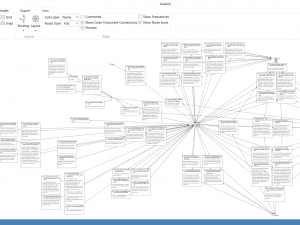
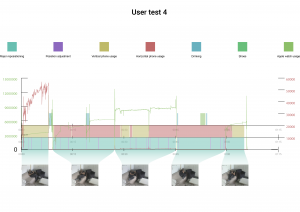
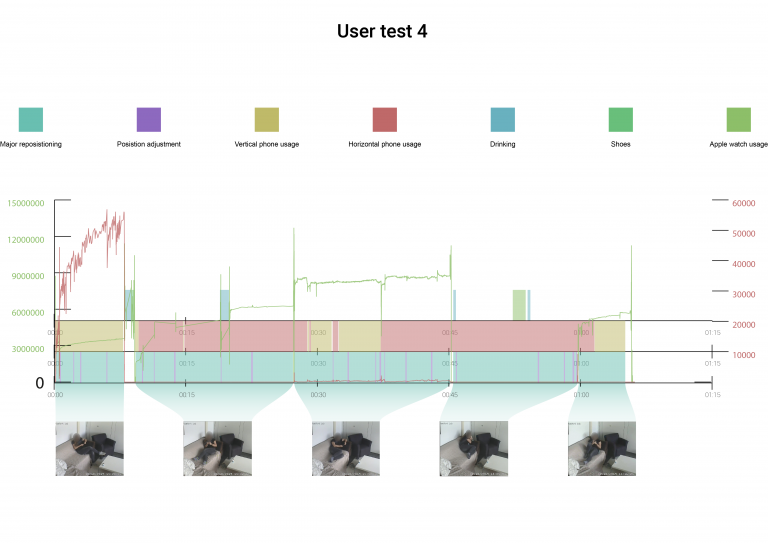
Afterwards, the data from the user test processed and analysed. For the interview, this meant transcribing the test and using ATLAS.ti to select and categorize quotes. Then these were analysed both inside of ATLAS.it and on paper. From here a model was created about their behaviour. The behavioural data was processed by labelling specific behaviours and visualising when they took place. The data from the sensors were placed on top of this to compare the two.
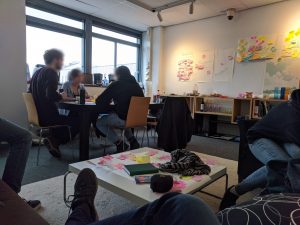
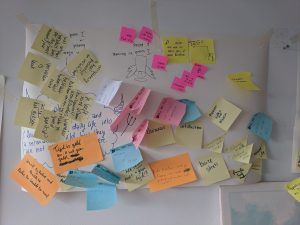
The results of these three types of data were compared to psychology research. Most noteworthy was the paper of Newman et al (2013), leisure and subjective well-being: a model of psychological mechanisms as mediating factors. To help me put the psychology research and my own research into perspective and formulate a clear design goal I organised a creative facilitated session. The session was let by a peer and was done in collaboration with students and users. Based on the performed research the following design goal was formulated.
Design Goal
I want to increase people’s subjective well-being during leisure after work by improving the quality of recovery-detachment and enforcing them to take control of how long they recover-detach.
Concept Development
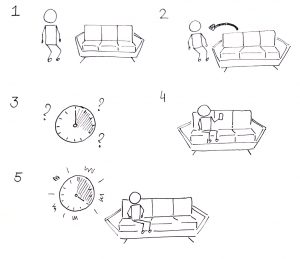
As a first step in the second phase, a rough storyboard was created. This was done to translate the design goal into a situation and possible interaction. (1) The product should detect the presence of the person in the room or on the couch. (2) The product should then invite the person to use the product. (3) Based on the input of the user, a timer for how long the user wished to relax should be set. (4) The product should then support the relaxation of the user. (5) When the time is over the product should stimulate the person to leave the couch and stop recovering.
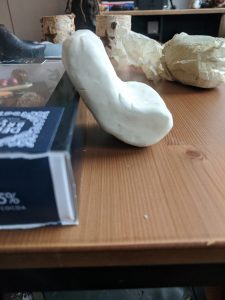
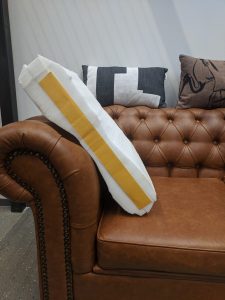
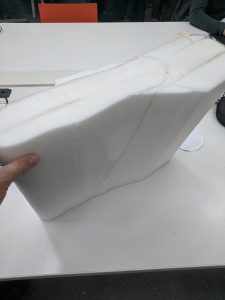
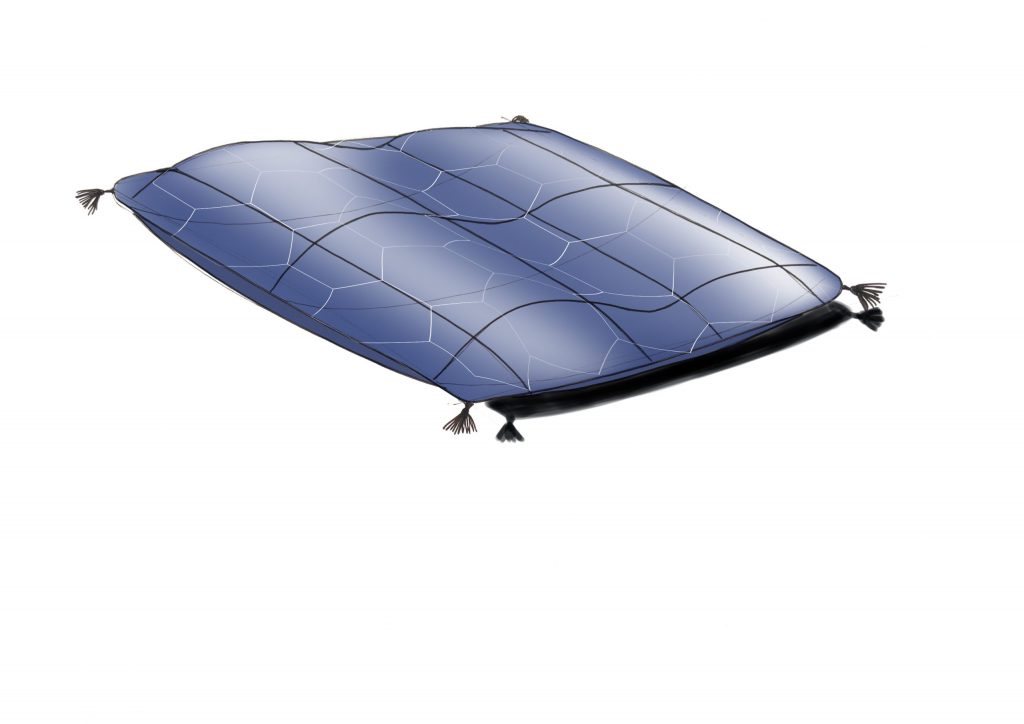
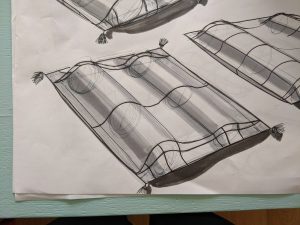
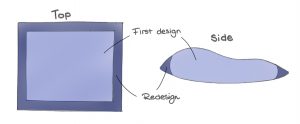
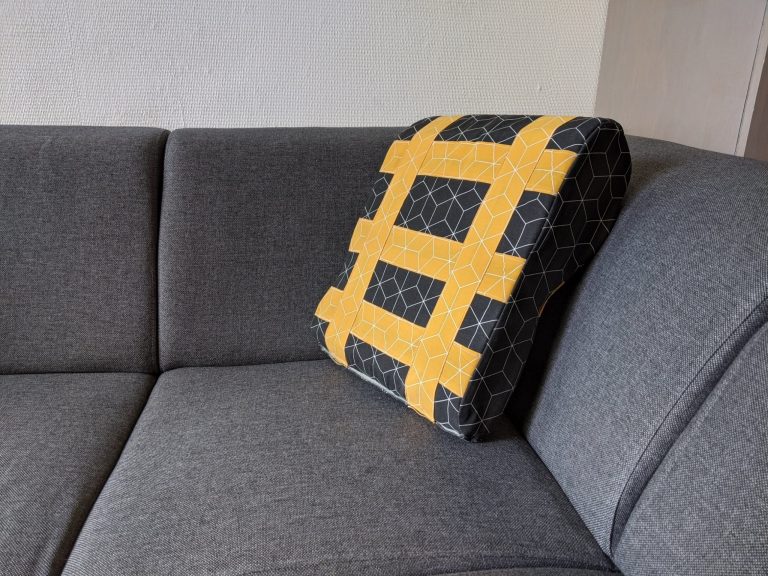
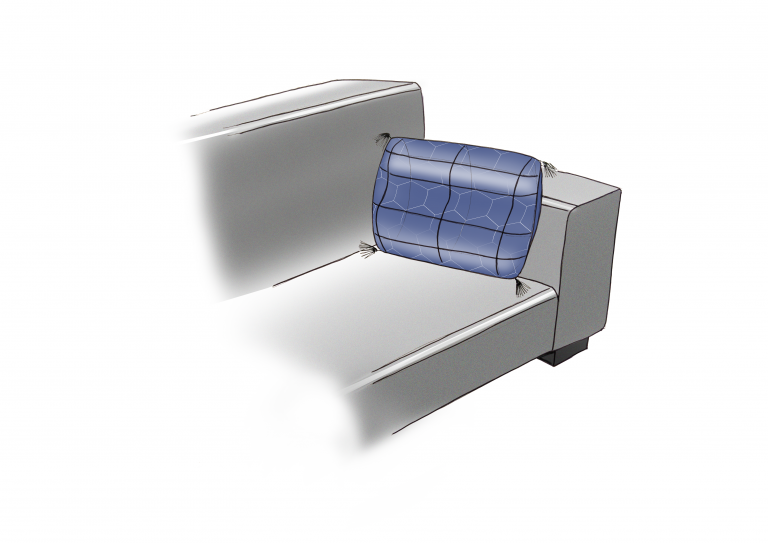
Based upon doing field research and the previous phase it was found that a pillow would be the most fitting product to transform into a smart object that can improve people’s time on the couch. On the image below, the different stages of creating the shape and a prototype of a pillow are shown. The pillow is shaped to allow it to be used and comfortable in a wide variety of different postures. This was done because during the first user test it was found that people naturally and regularly switched there sitting positions. The pillow aims to provide comfort is as many of the postures found in the user test.
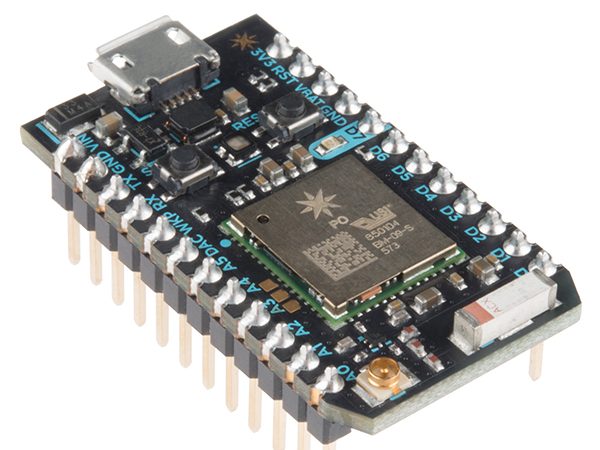
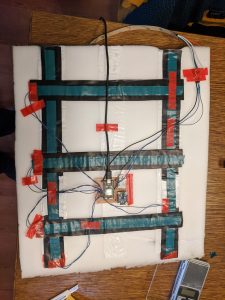
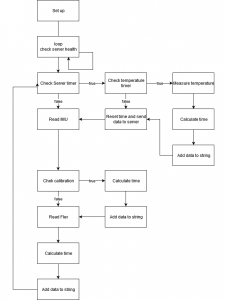
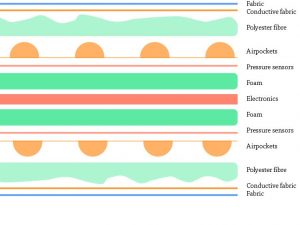
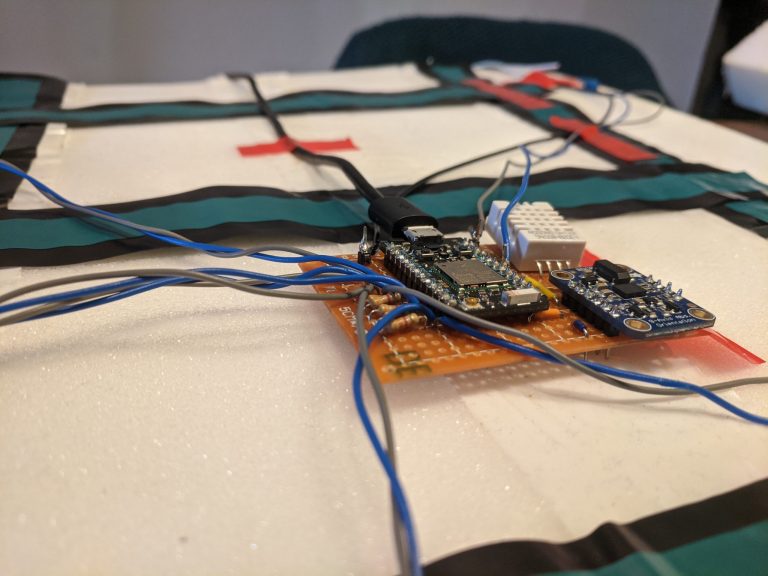
Next to designing the shape of the pillow, the first part of its intelligence was also designed, its senses. The goal of these senses was for the pillow to be able to “see” how it’s being used. To do so, the temperature, the orientation and the pressure were being measured. The temperature and orientation sensors were bought and the pressure sensors were made. They were placed inside the pillow and together they were able to collect data about its usage and sent this data to a server.
Perspective Discovery
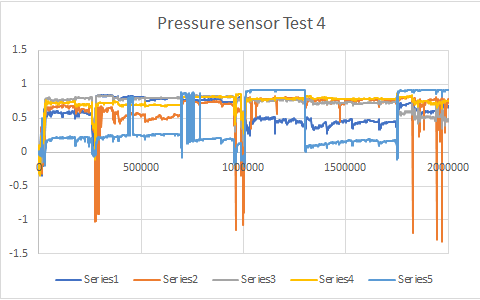
The goal of the thirds phase was to understand the perspective of the user and of the product. To get this understanding, that data-enabled prototype was used during a user test. This test consisted of three parts, usage of the pillow, interview about the usage and co-creation about the further development of the pillow. The data from this test was then processed into visuals to enable analysis. To do so, the machined data was first put into excel and get an initial image of what the data looked like.
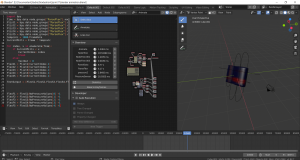
The Excel graph, however, did not provide many insights. Therefore I looked for a better, more inspiring way to visualise the sensors data. I landed on creating digital twin that represented the pillow in real life. To create this digital representation blender was used. First, the model was created, afterwards, the data from the server was used as input for an animation.
This animation was then put next to a video of the observation to link the two together. Some interesting behaviours were compiled into a video. This video was then used to analyse the data gathered from the user test which was then used as an input for further designing the product.
Concept Design
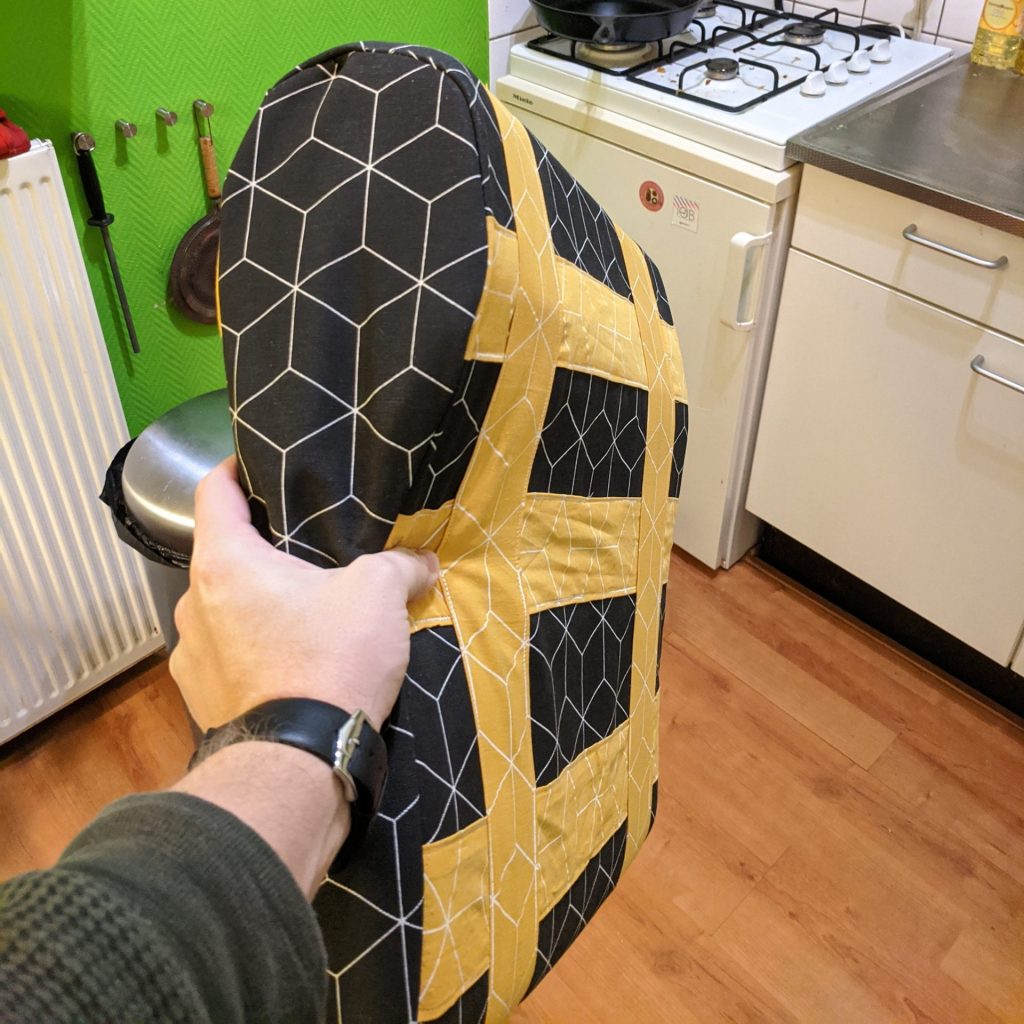
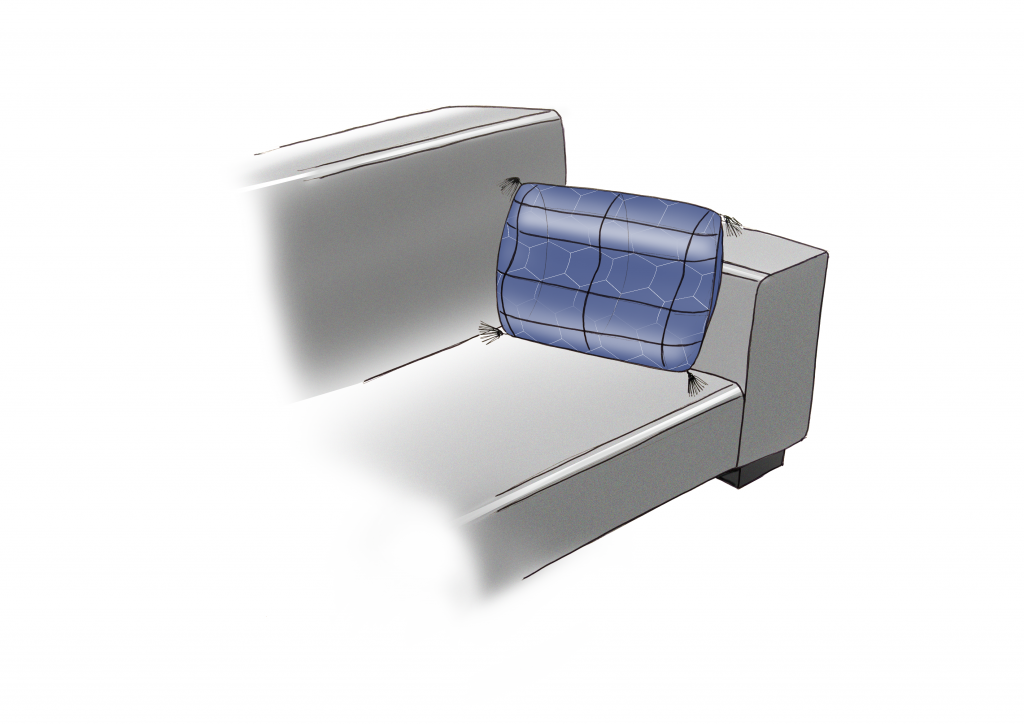
During the fourth phase, the concept of the pillow was further designed. During this procces the visualisation from the previous phase was used continously. First the shape of the pillow was redesigned. The inner, ergonomic, shape was kept but the outer shape was changed to look more like a throw pillow.
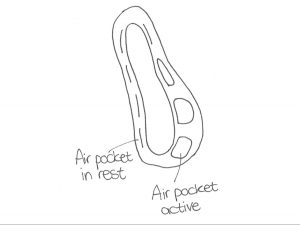
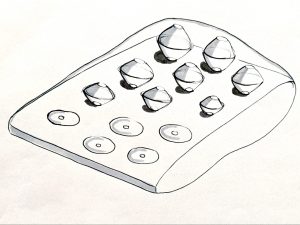
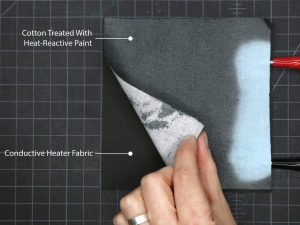
Secondly, the pillow was given actuators to allow it interact with the world around it. The first actuator that was added was a conductive fabric. This fabric heats up as a current is applied to it. This allows the pillow to provide the user with extra warmth. Secondly air pockets are added to the pillow. This allows the pillow to encapsulate and hug the user. It also provides the pillow with way to communcate with the user. For instance by activating all air pockets for a short burst the pillow creates discomfort for the user letting the user know their time is up
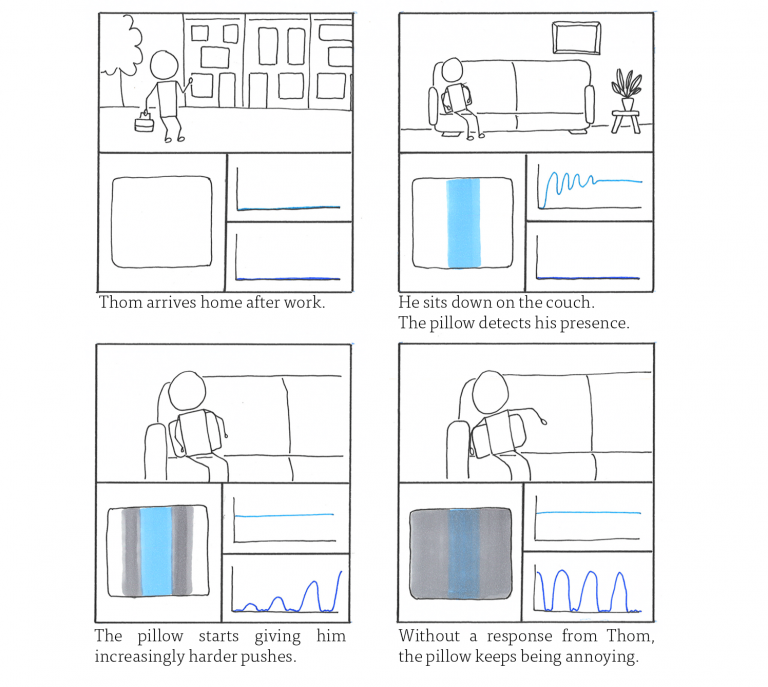
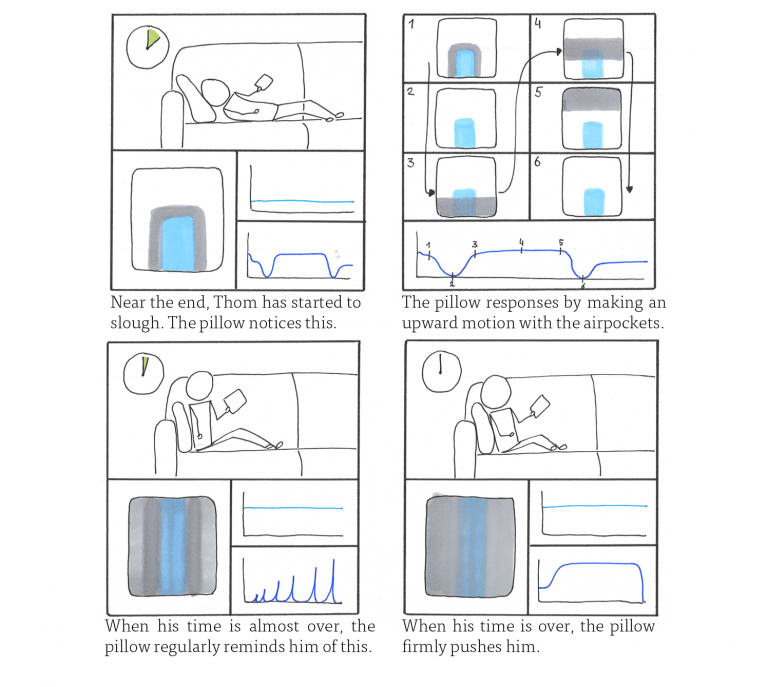
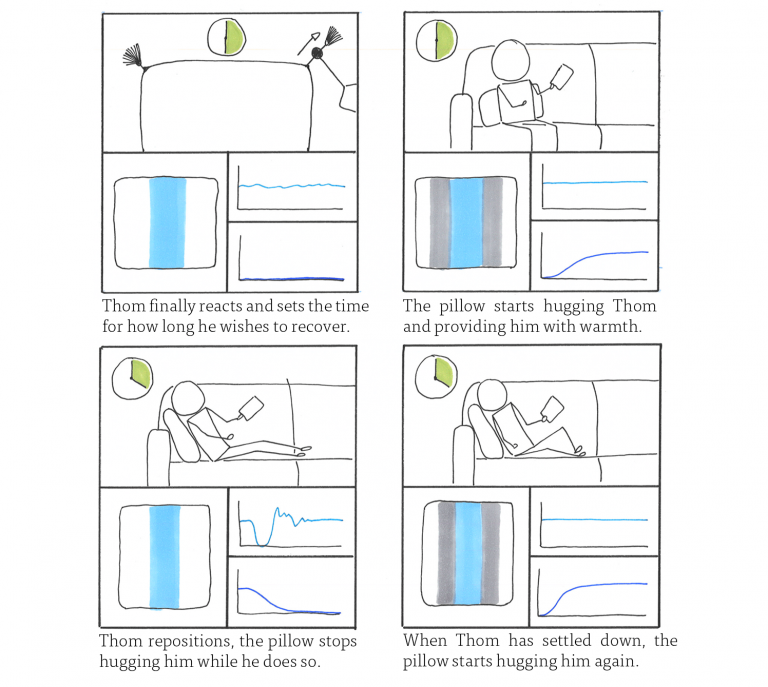
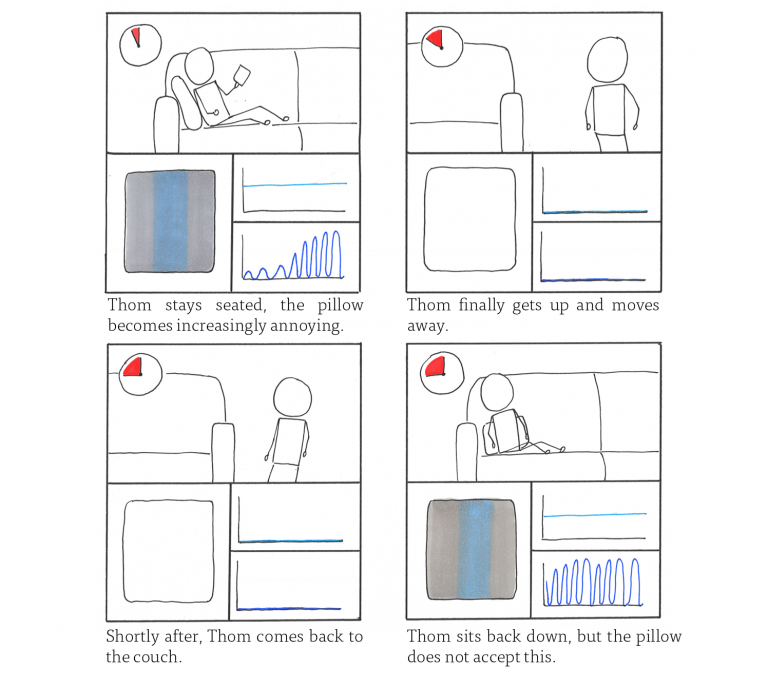
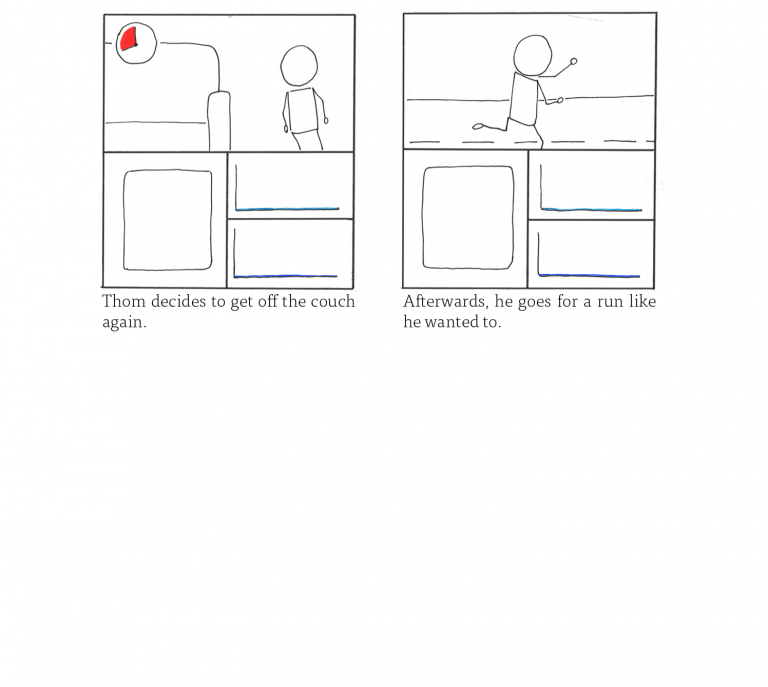
With the addition of actuators, the interaction with the pillow was further developed. This was done by creating a storyboard. Each drawing in the storyboard consists of 3 parts, the top part shows the situation. In the bottom left part the pillow is displayed, blue shows pressure applied by the user, grey shows air pockets that are activated by the pillow. In the bottom right two graphs can be seen, the top shows the pressure applied by the user over time, the bottom the actuation of the air pockets over time by the pillow.
More Info
For more info, you can view my complete graduation presentation, or read my graduation thesis. If you have any additional questions, feel free to contact me.
